
CPI - 2026 -01
When things are flat, volatility and compositional shifts are the story

Headlines
Measuring price change (aka inflation) depends on the starting and ending points of the comparison. Essentially prices are flat. We had the economically silly but possibly politically useful GST holiday gift over the previous Christmas. The first chart (source Daily Chart 1) shows the impact of the tax holiday.
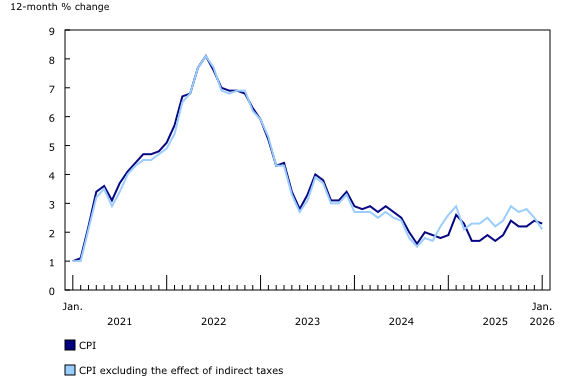
The light-blue series without taxes (Detail pg3) shows that the price level converges to the standard series. The dark-blue series is really what matters to most of us. It moves down and back up before flattening. A 12-month rate estimate moves from a previous peak to the current point with a recent history of bounces. Comparing over 6 months (right chart), measured price change is declining. Even shelter prices are helping. Removing food and energy indicates net deflation. Compared over 12 months (left chart), price change is flat, thanks to gas prices.


Energy price change makes a big difference.
Food Prices
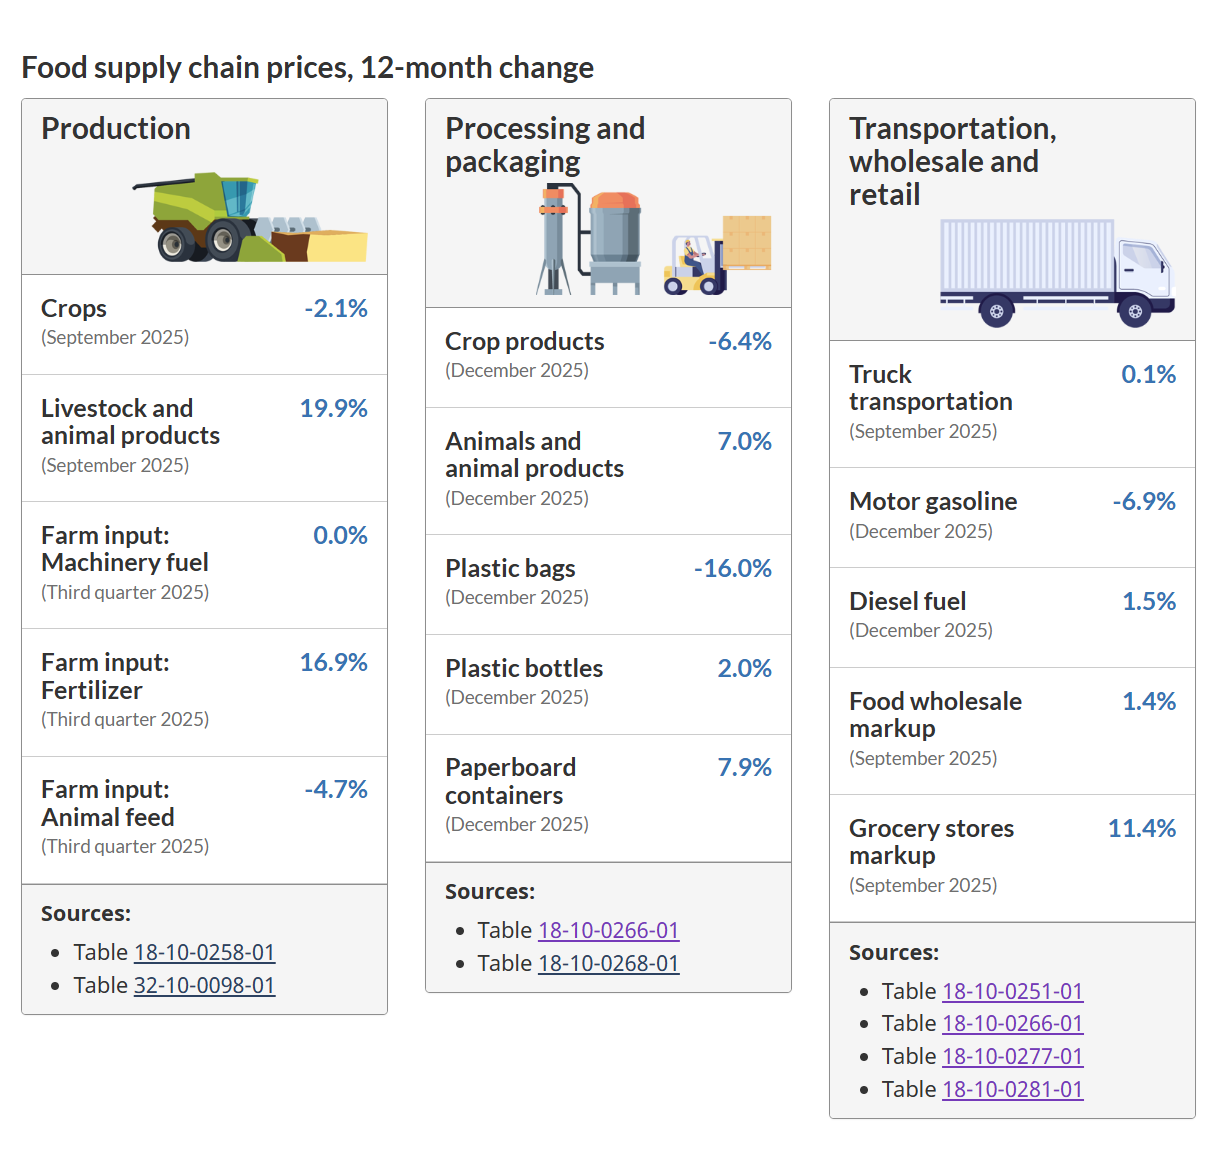
The dominant share of CPI goods are imported. Even domestically-sourced food items such as meat are dominantly supply driven. The Daily highlights the strong or stable harvests in the producer regions for price change in fruits and vegetables.


Meat prices rose because of pasture issues in western Canada, feed costs, and export demand from the US. The apparent price change in fresh fruit and vegetables is impacted by the comparison point. The latter prices are also affected by the availability of seasonal Canadian supply.
However, distribution margins, the dominant domestic influence, also matters. The food price data hub shows an annual change in grocery store markups of 11.4% as of September 2025.
The big price changes are domestic or foreign supply driven.
The provincial distribution of the price changes for fruit and vegetables shows the importance of distribution and competition in our food system.


Western Canada seems to be exposed to price changes more than other parts of the country.
Shelter Costs
Shelter costs have decelerated both for rental and owned accommodation.


The provincial distribution is reflective of local market conditions since mortgage costs are largely national.
Services
Service price inflation is affected by housing factors, insurance, taxes but also restaurant food. The latter category was really bounced by the GST holiday.


Direct labour costs are not the dominant factor. Supply and policy matter.
For Review on Price Drivers
A previous substack covers the issue of domestic supply of goods and supply management of key agricultural commodities. The latter has real value to Canada and Canadian consumers and should not be conceded to the US (look at my milk price chart)
Supply Driven vs Supply Management is the link.
Detailed Charts
Charts by province and by 6- and 12-month analysis frames are available.
AI is not used. All of the charts and ideas are the responsibility of Paul Jacobson.
CPI Detailed charts for January 2026 is the link.
Thank you for the always excellent and clarifying writeups Paul, they are much appreciated!