
LFS - through 2026-05
Increases matter but..

Headlines
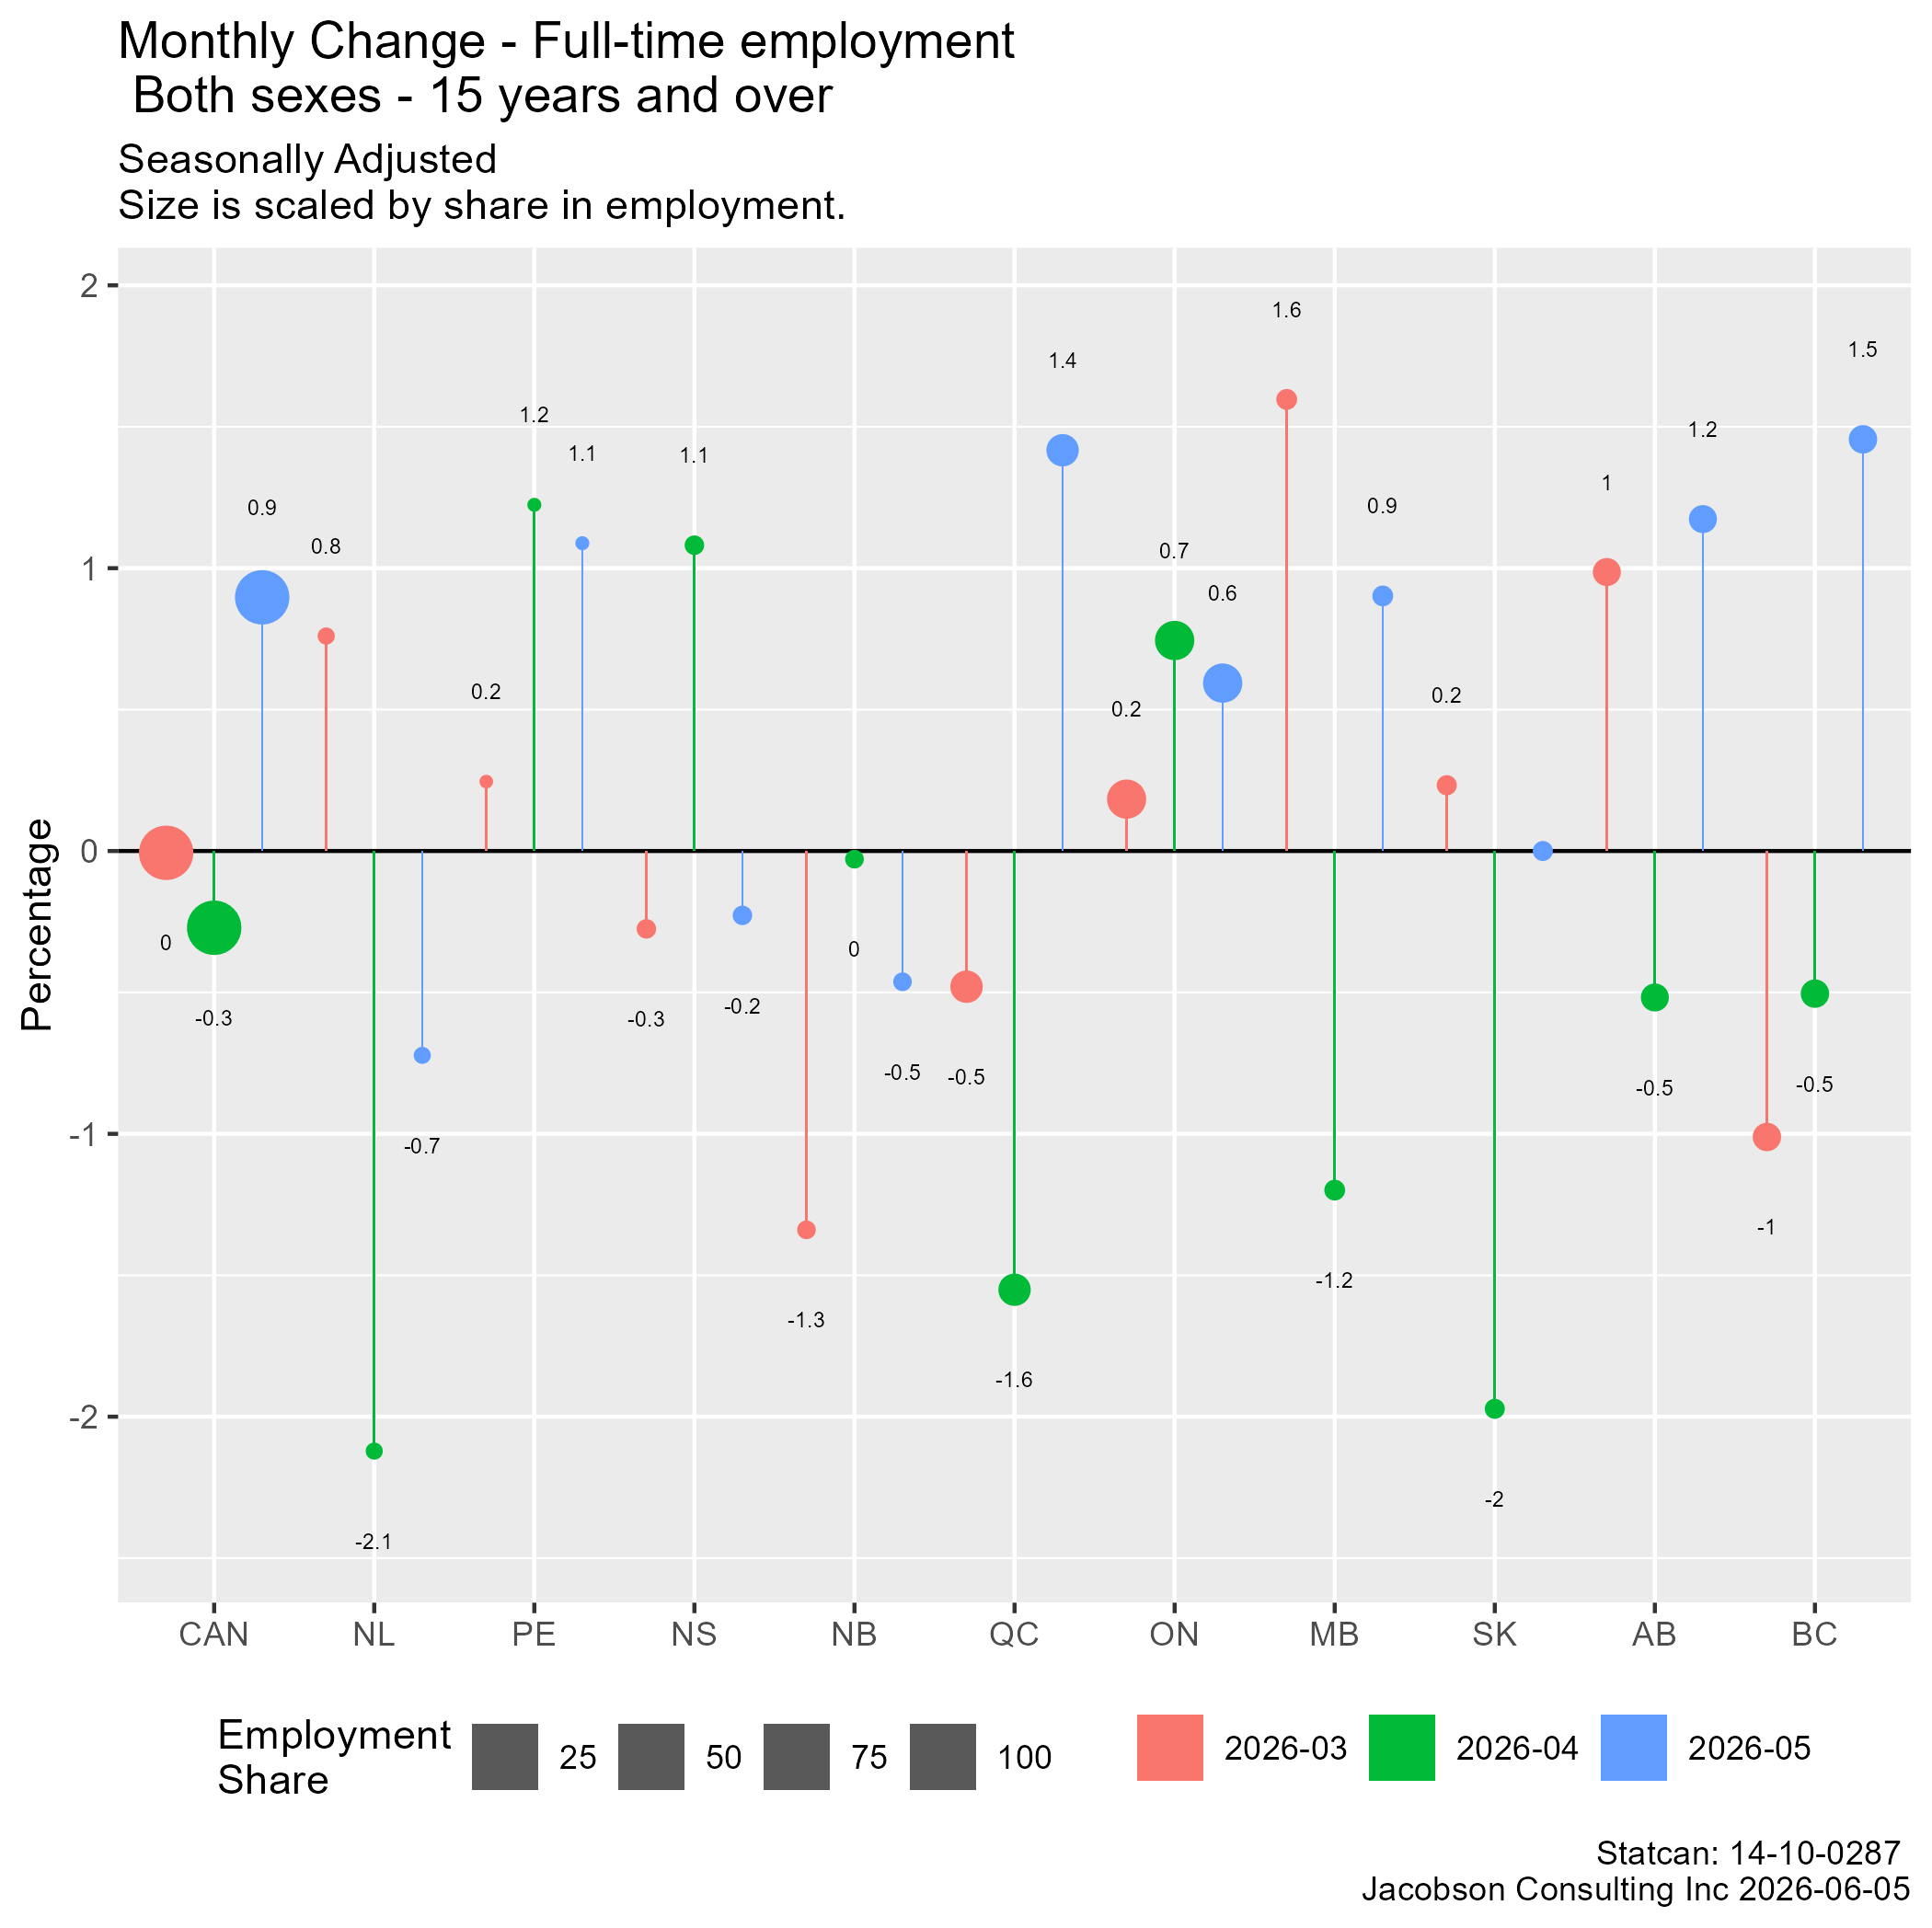
Full-time employment leads a charge which highlights the volatility of these survey result. Note QC, BC and AB in this aggregate chart.
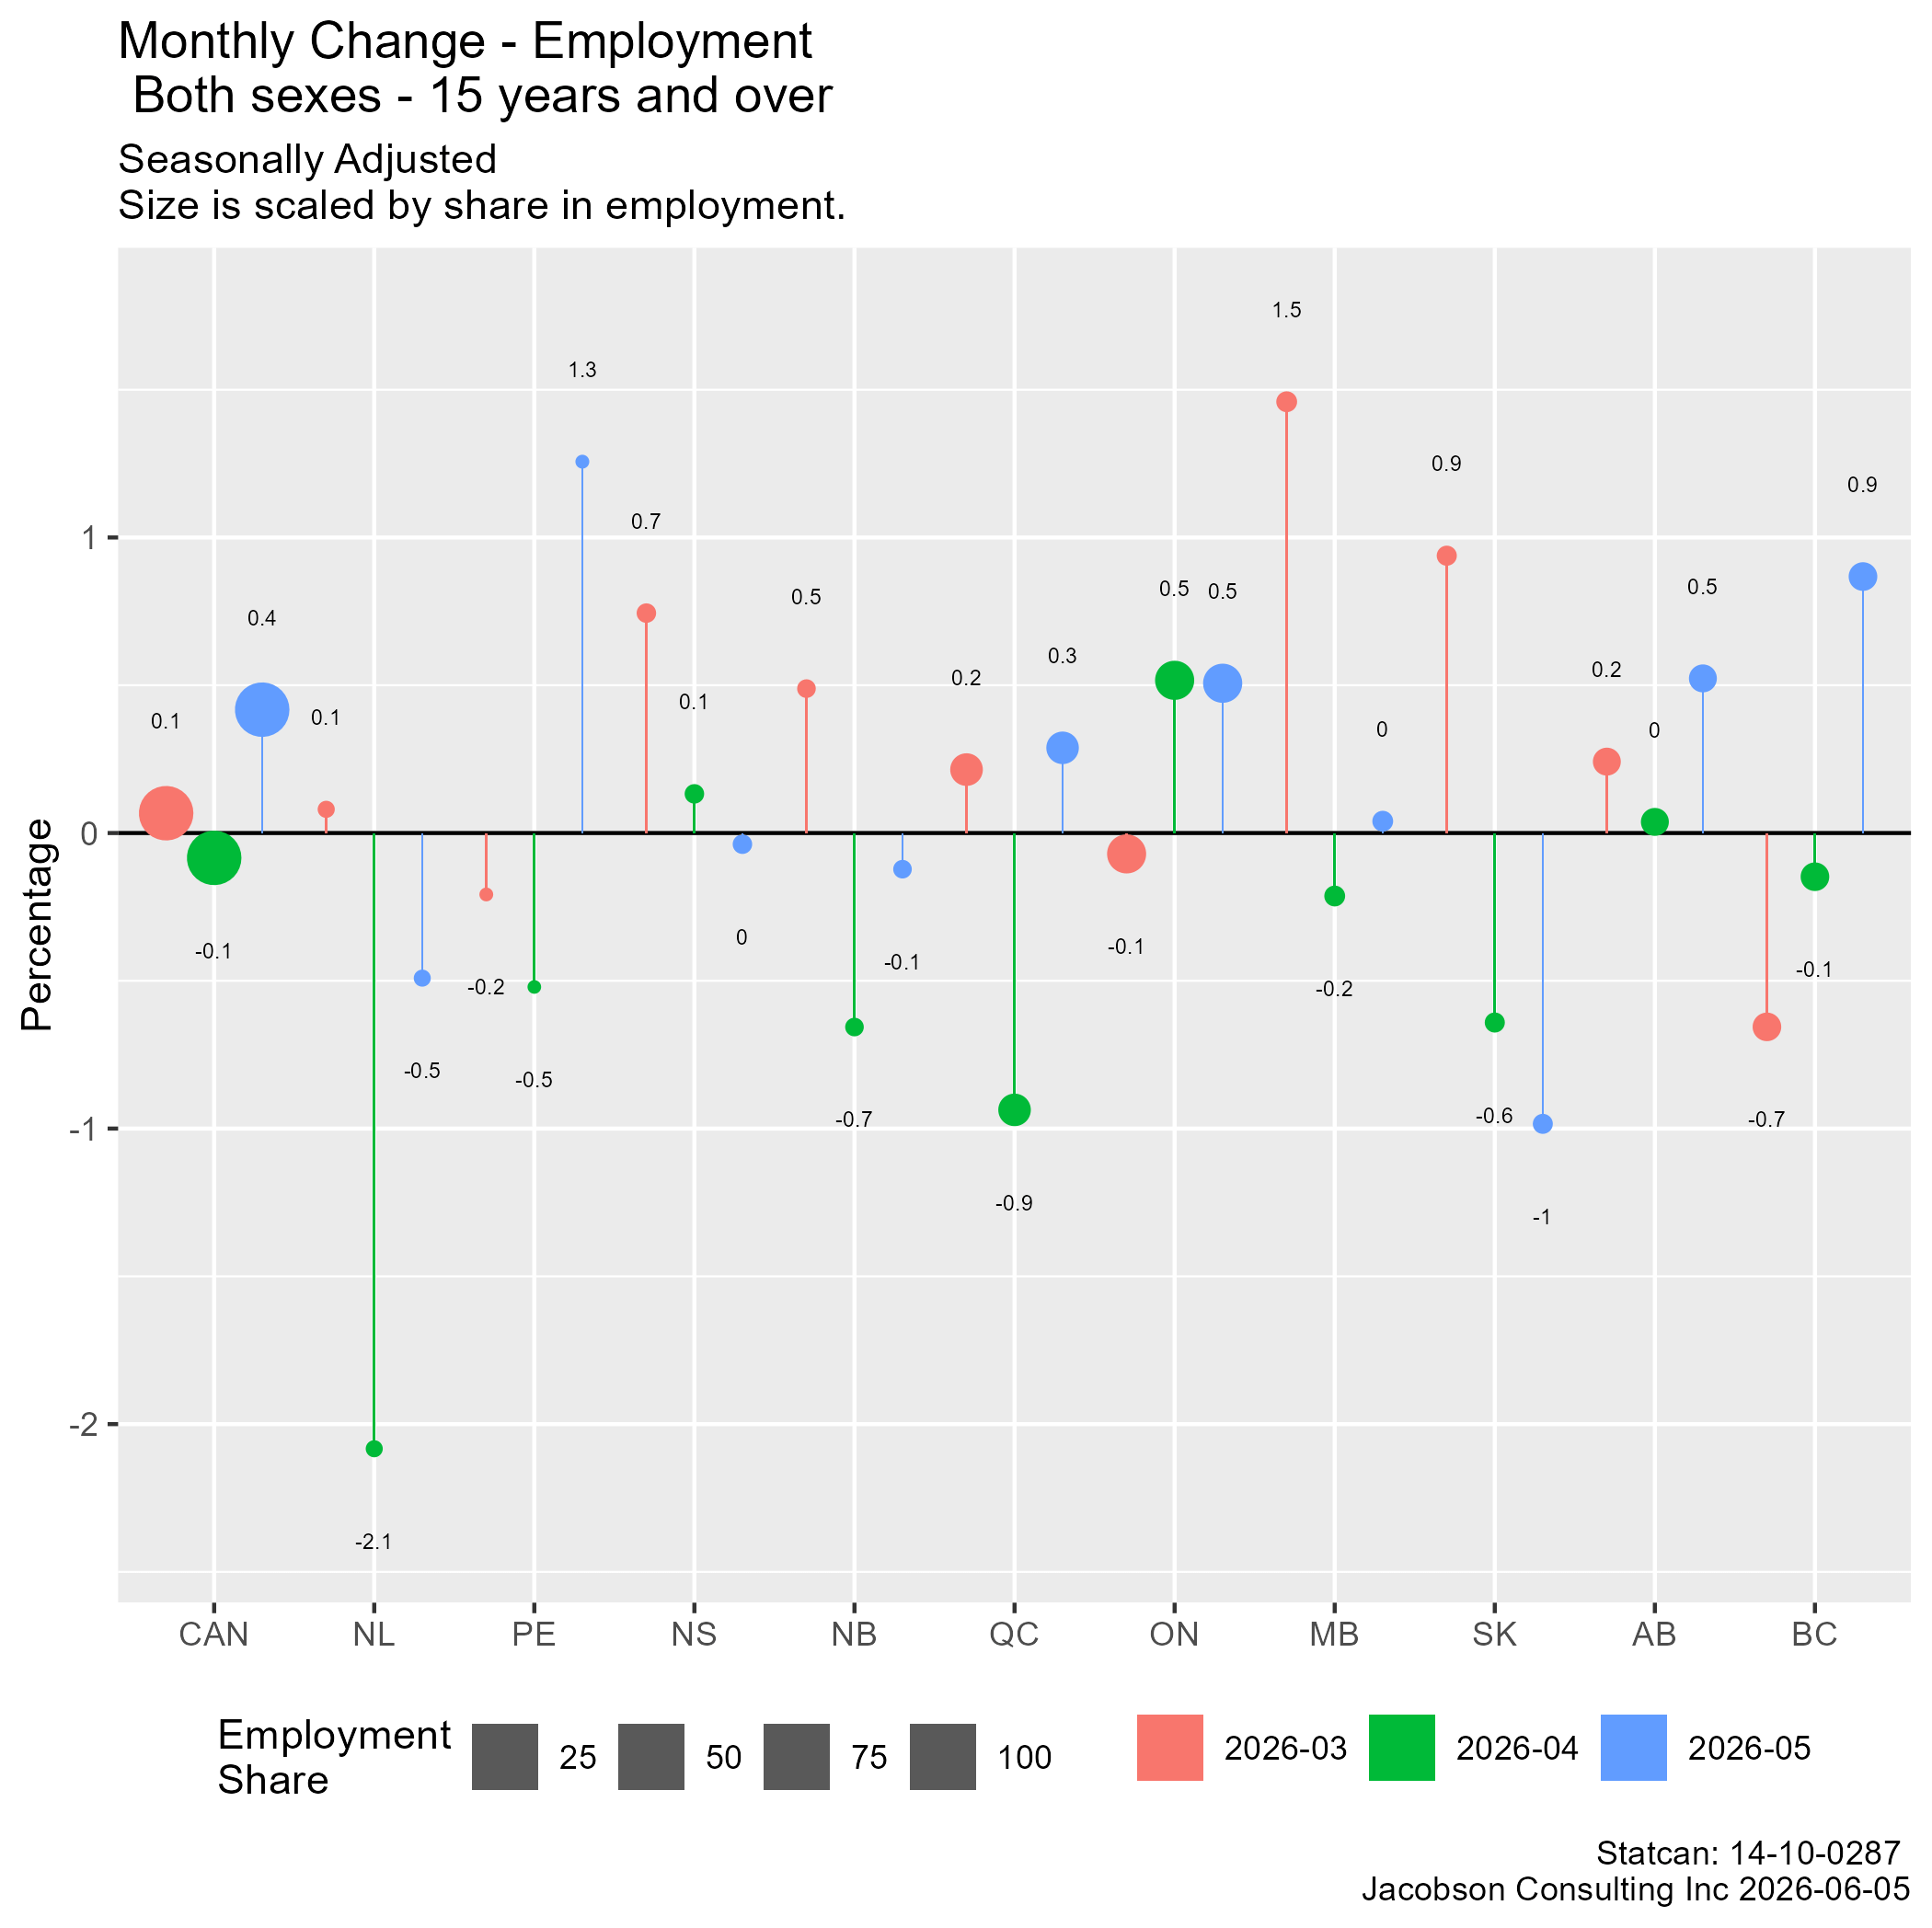
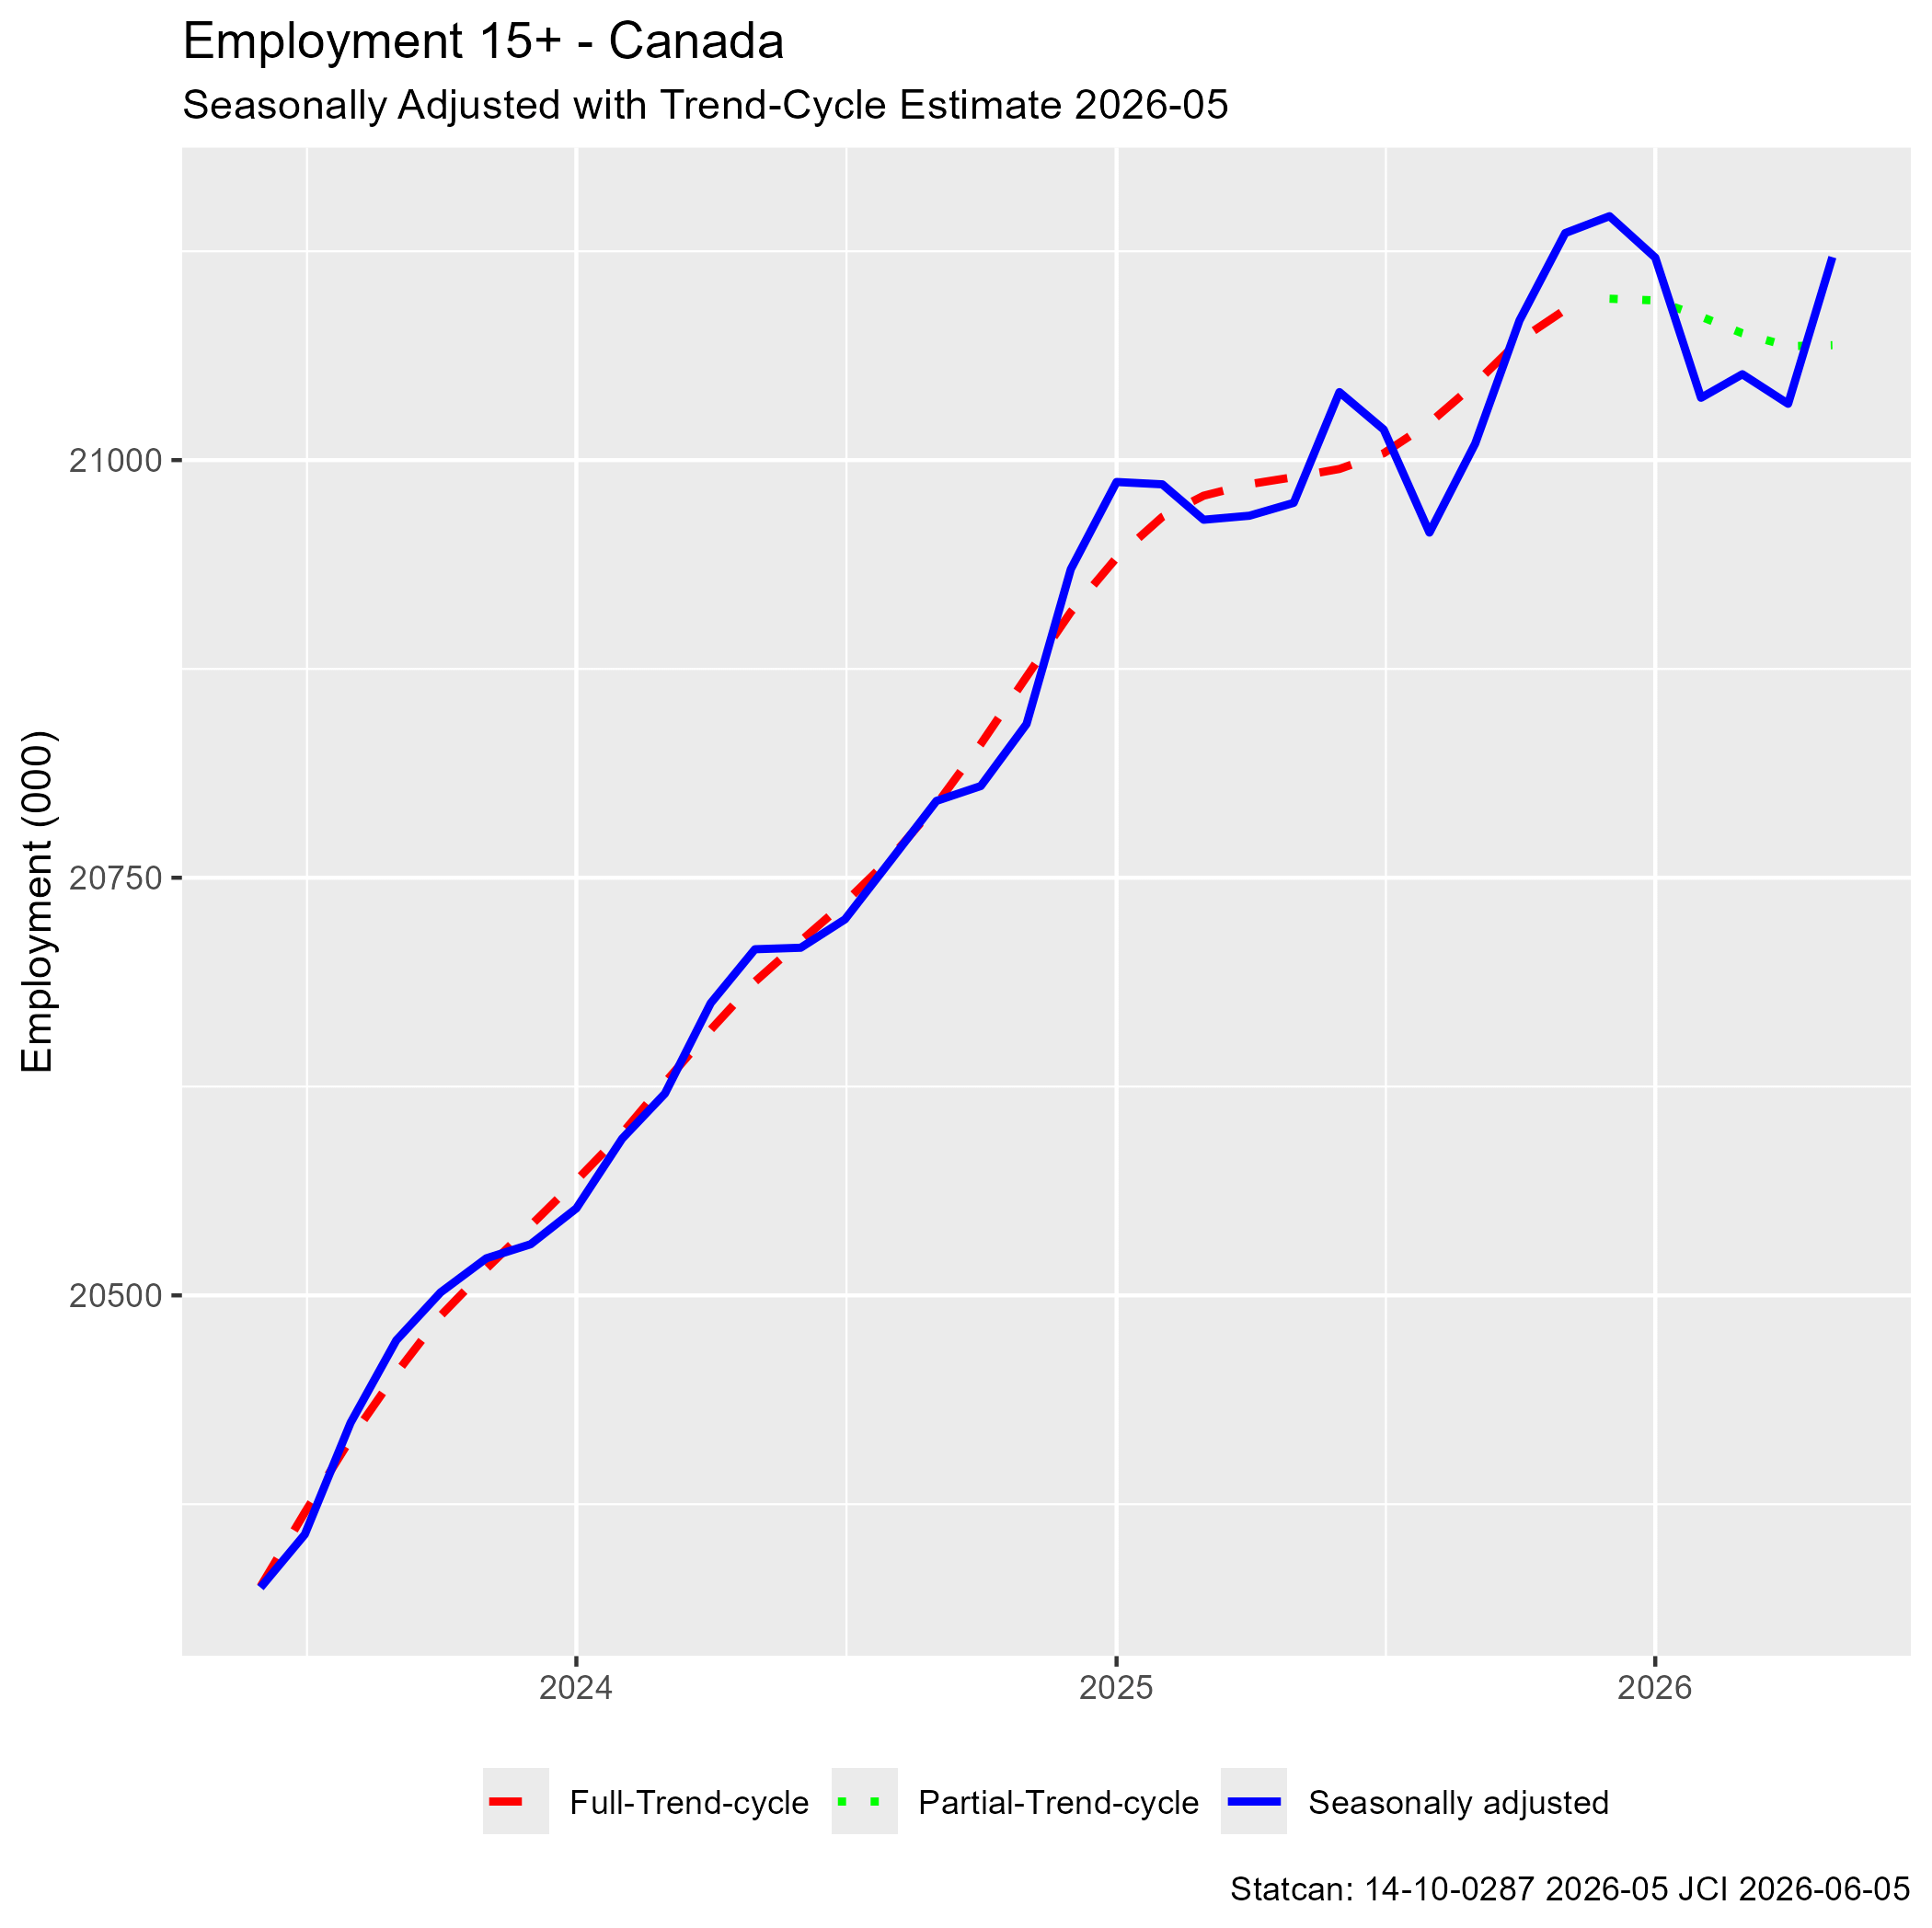
Uncertainty in the industrial outlook and policy as well as an unstable source population (temporary workers and students), have led to a bouncy standstill in the aggregate outlook.
My detailed charts contain lots of employment rate examples but the source population estimate instability means that neither the employment or unemployment rates receive my focus.
Industrial Focus
The detailed charts contain industrial employment for each province. The Canada level chart provides a summary but regional issues are key.
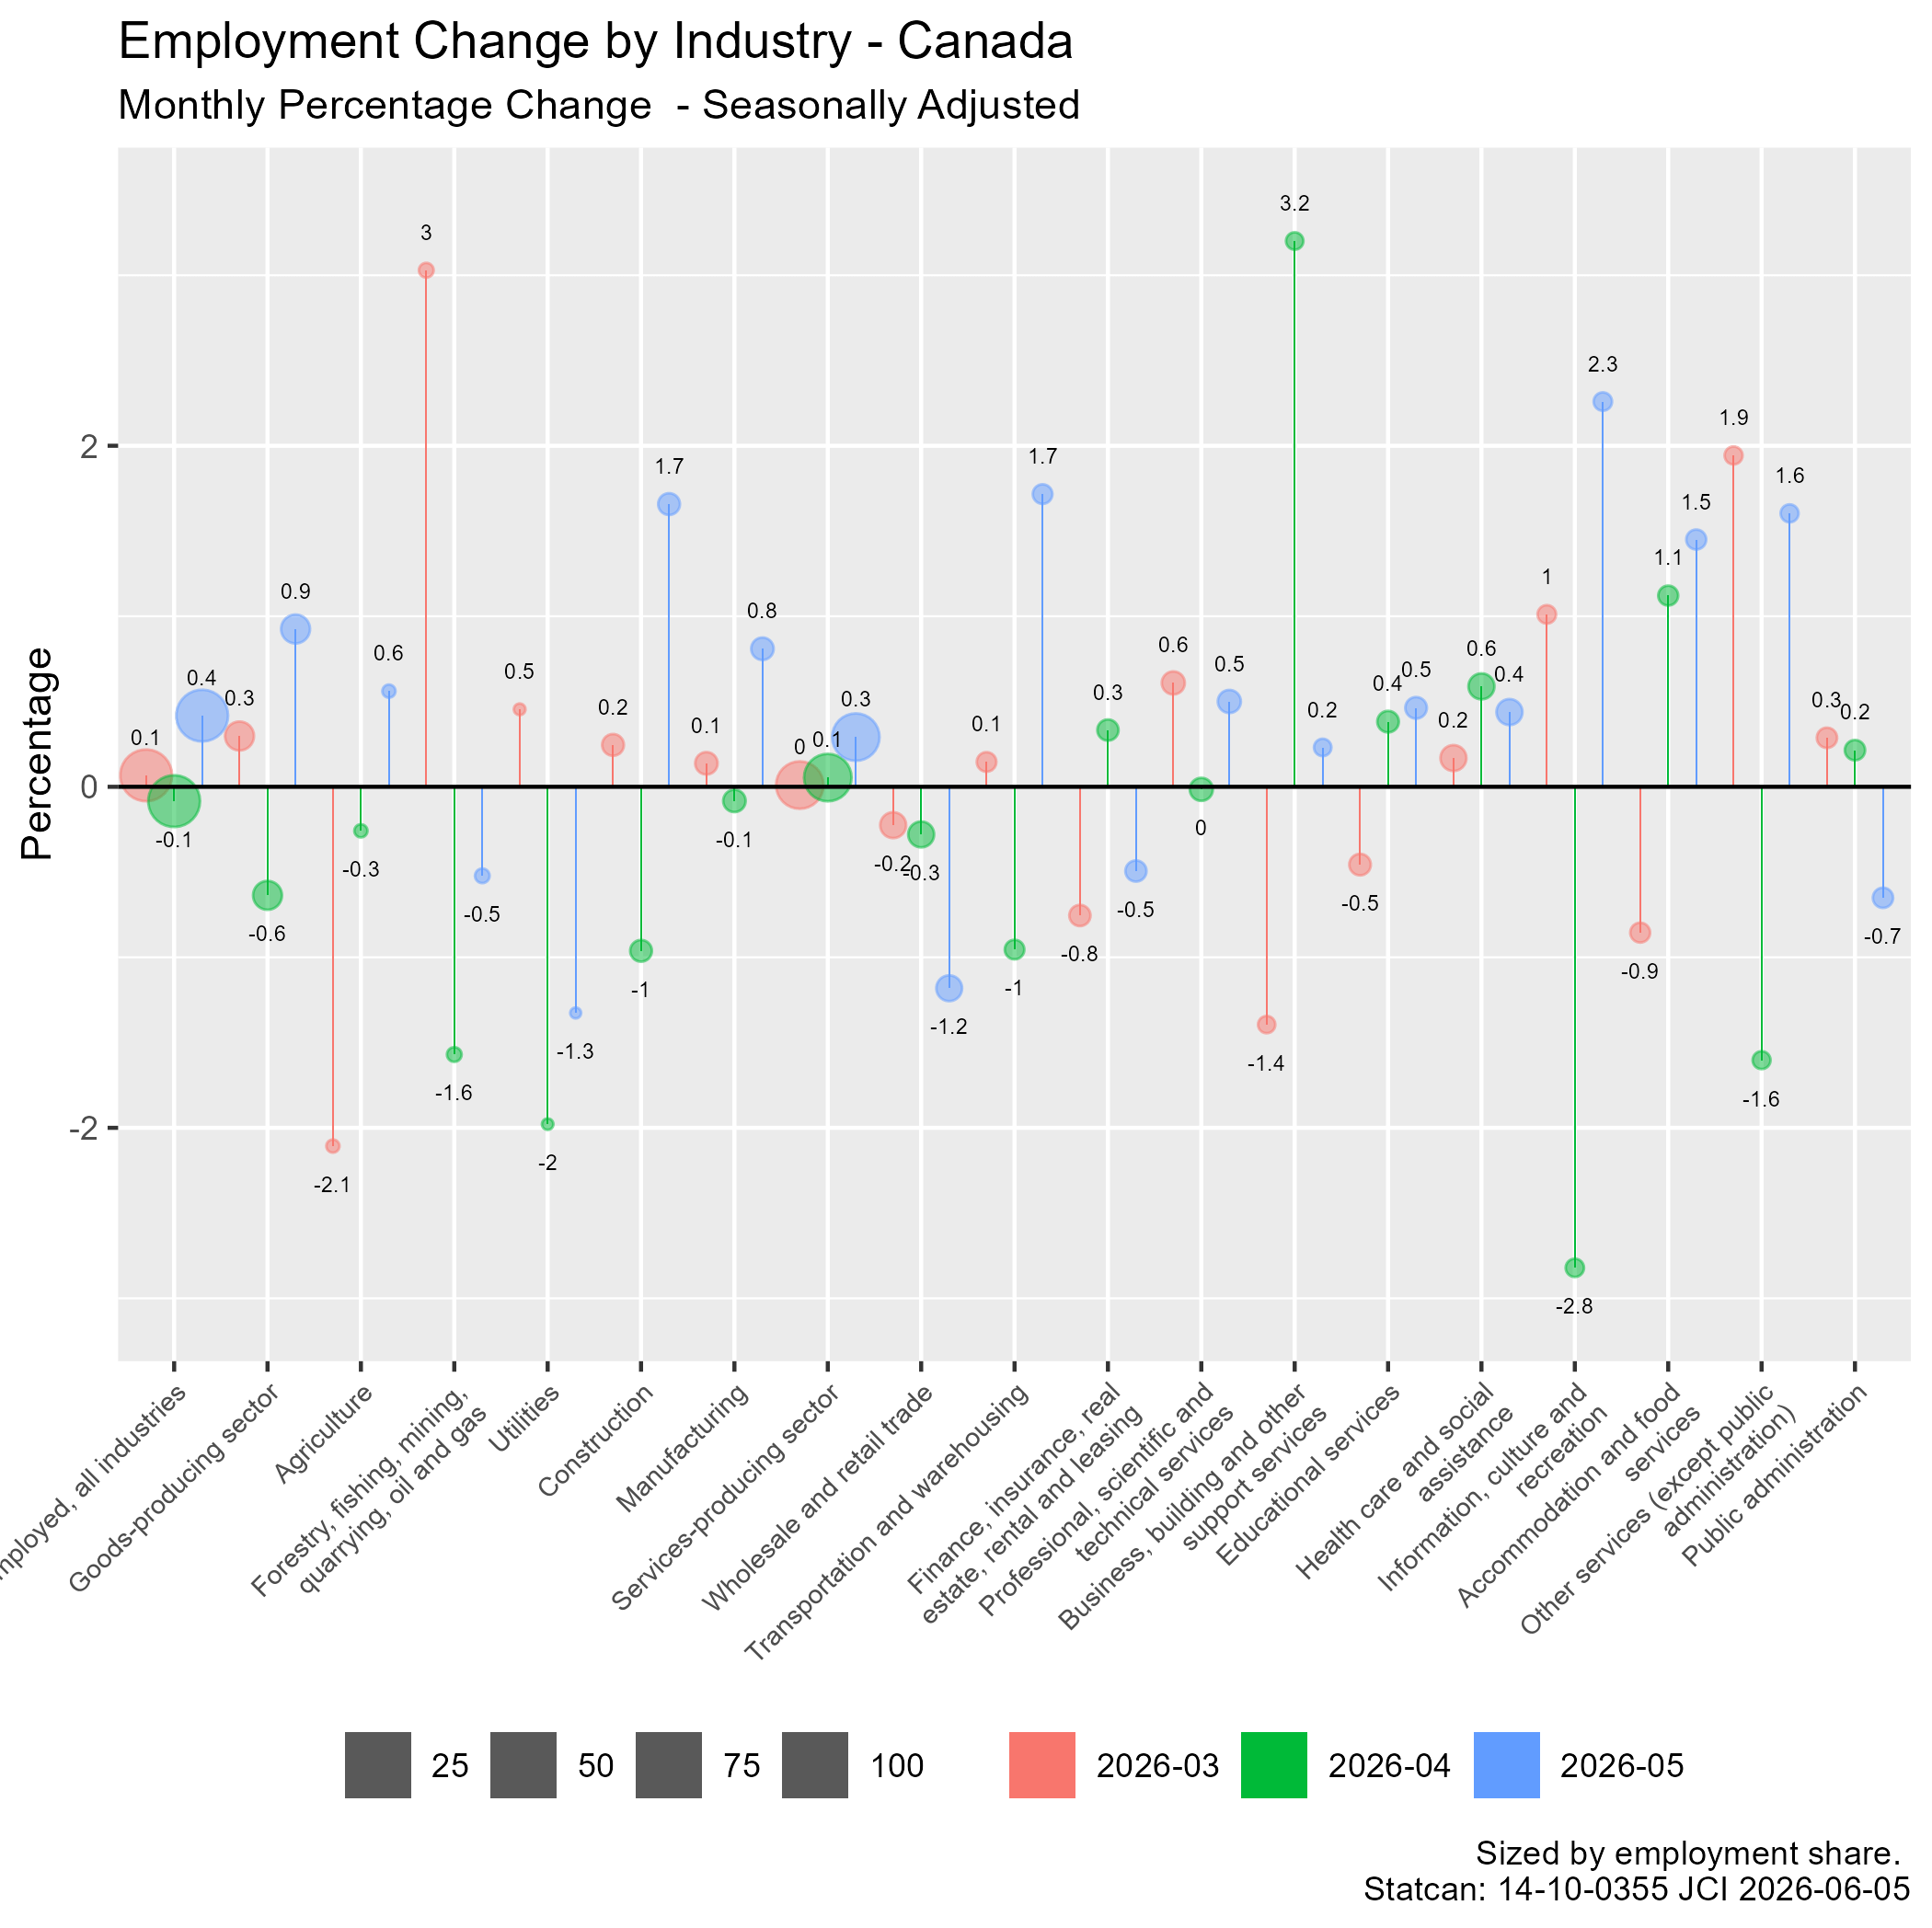
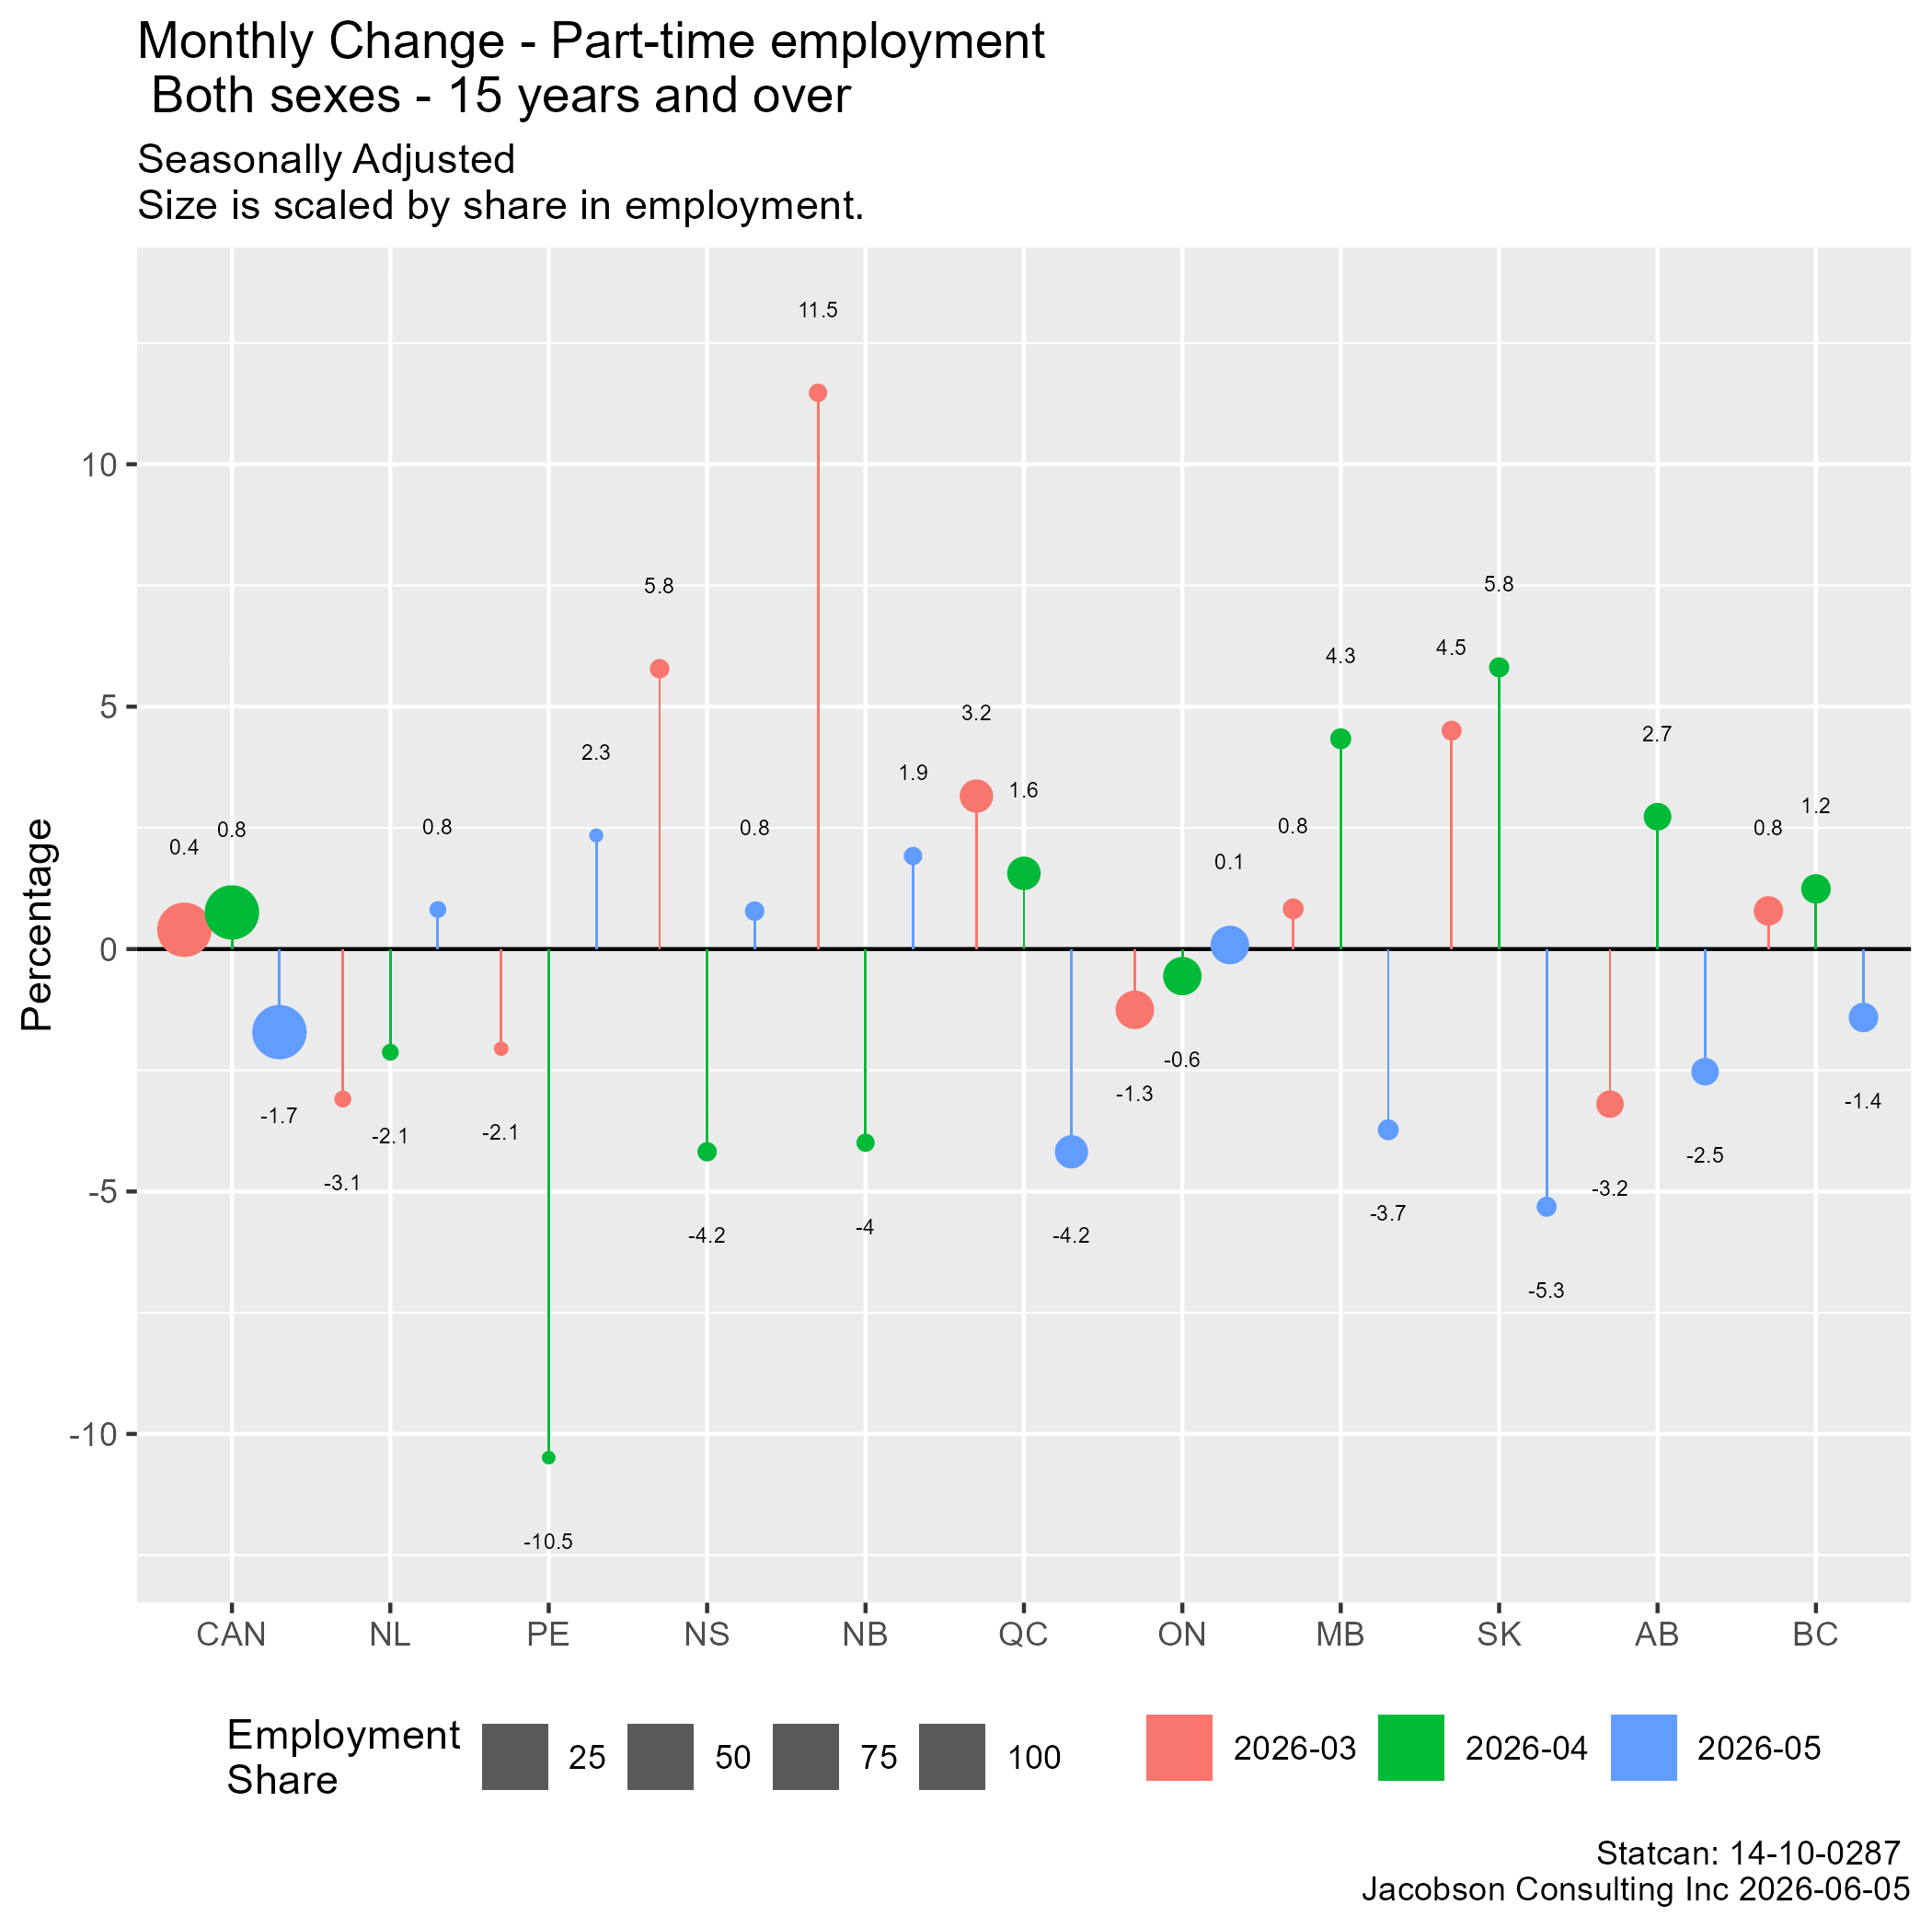
The bounces in finance and professional services highlight the analytical issues. The downturn in retail and wholesale is one of the part-time issues to follow.
In ON, there was a large flip in the construction as well as manufacturing sectors. These are more full-time oriented
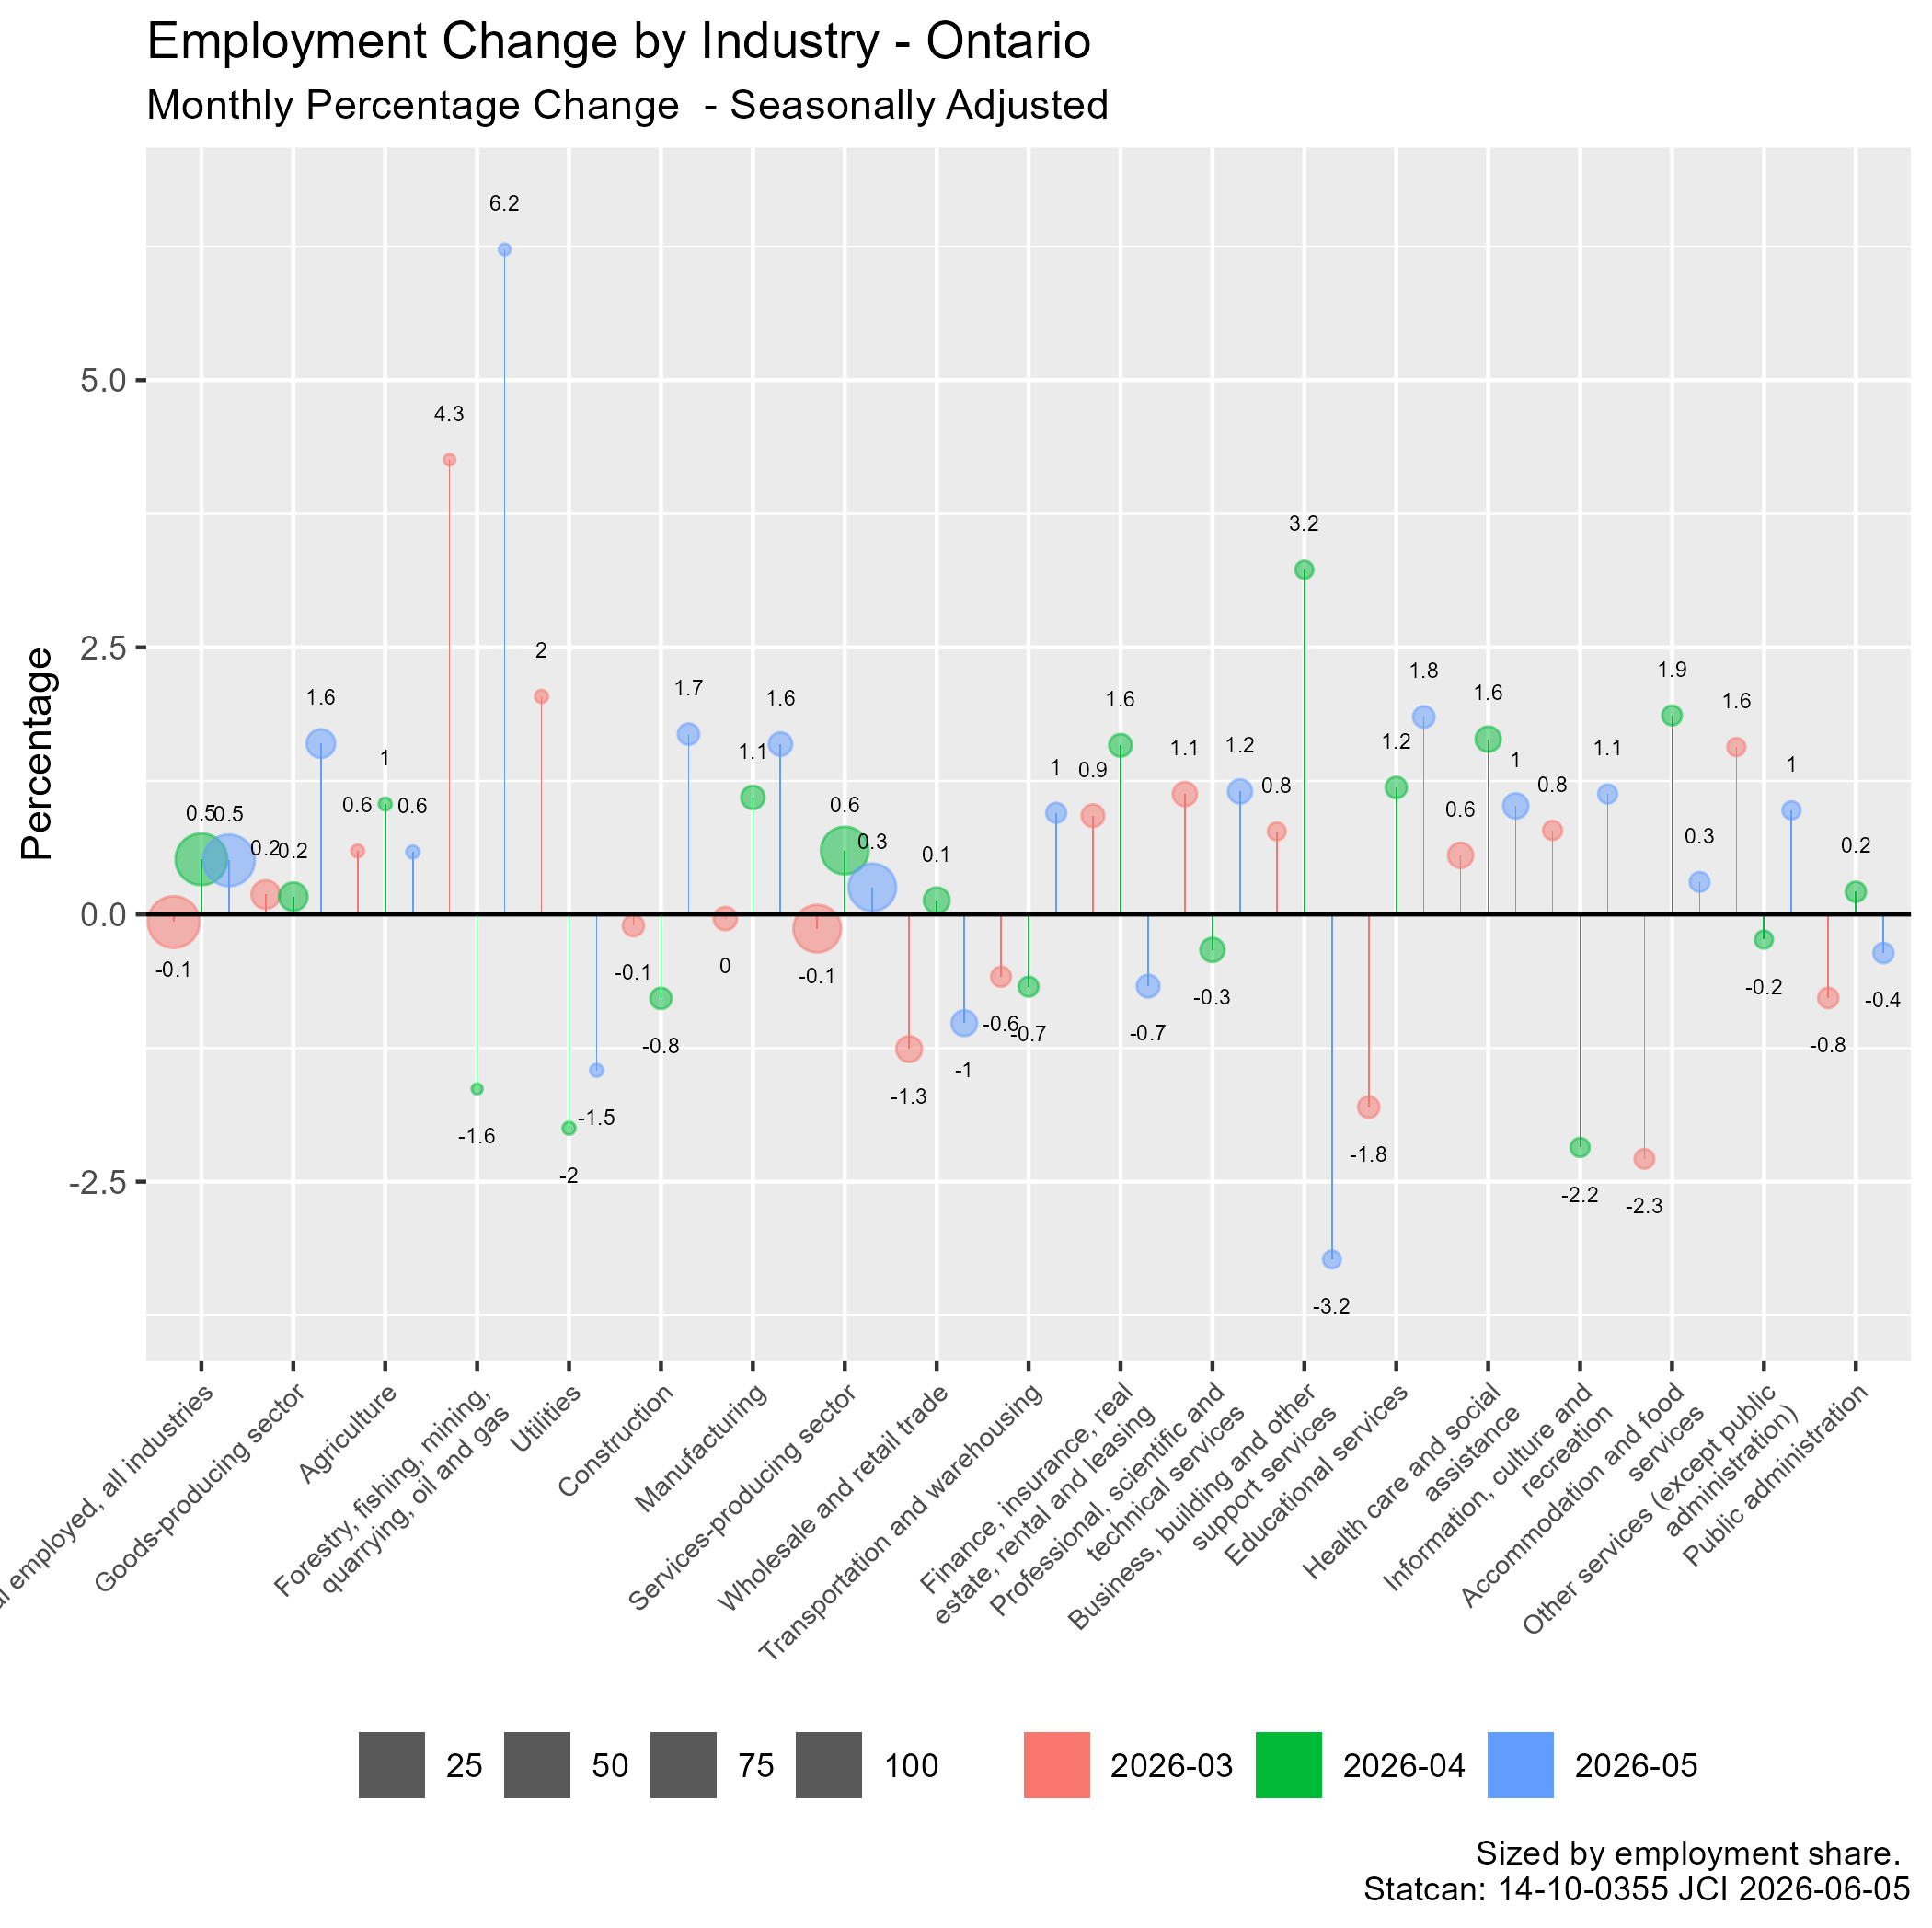
In QC, the story is similar but
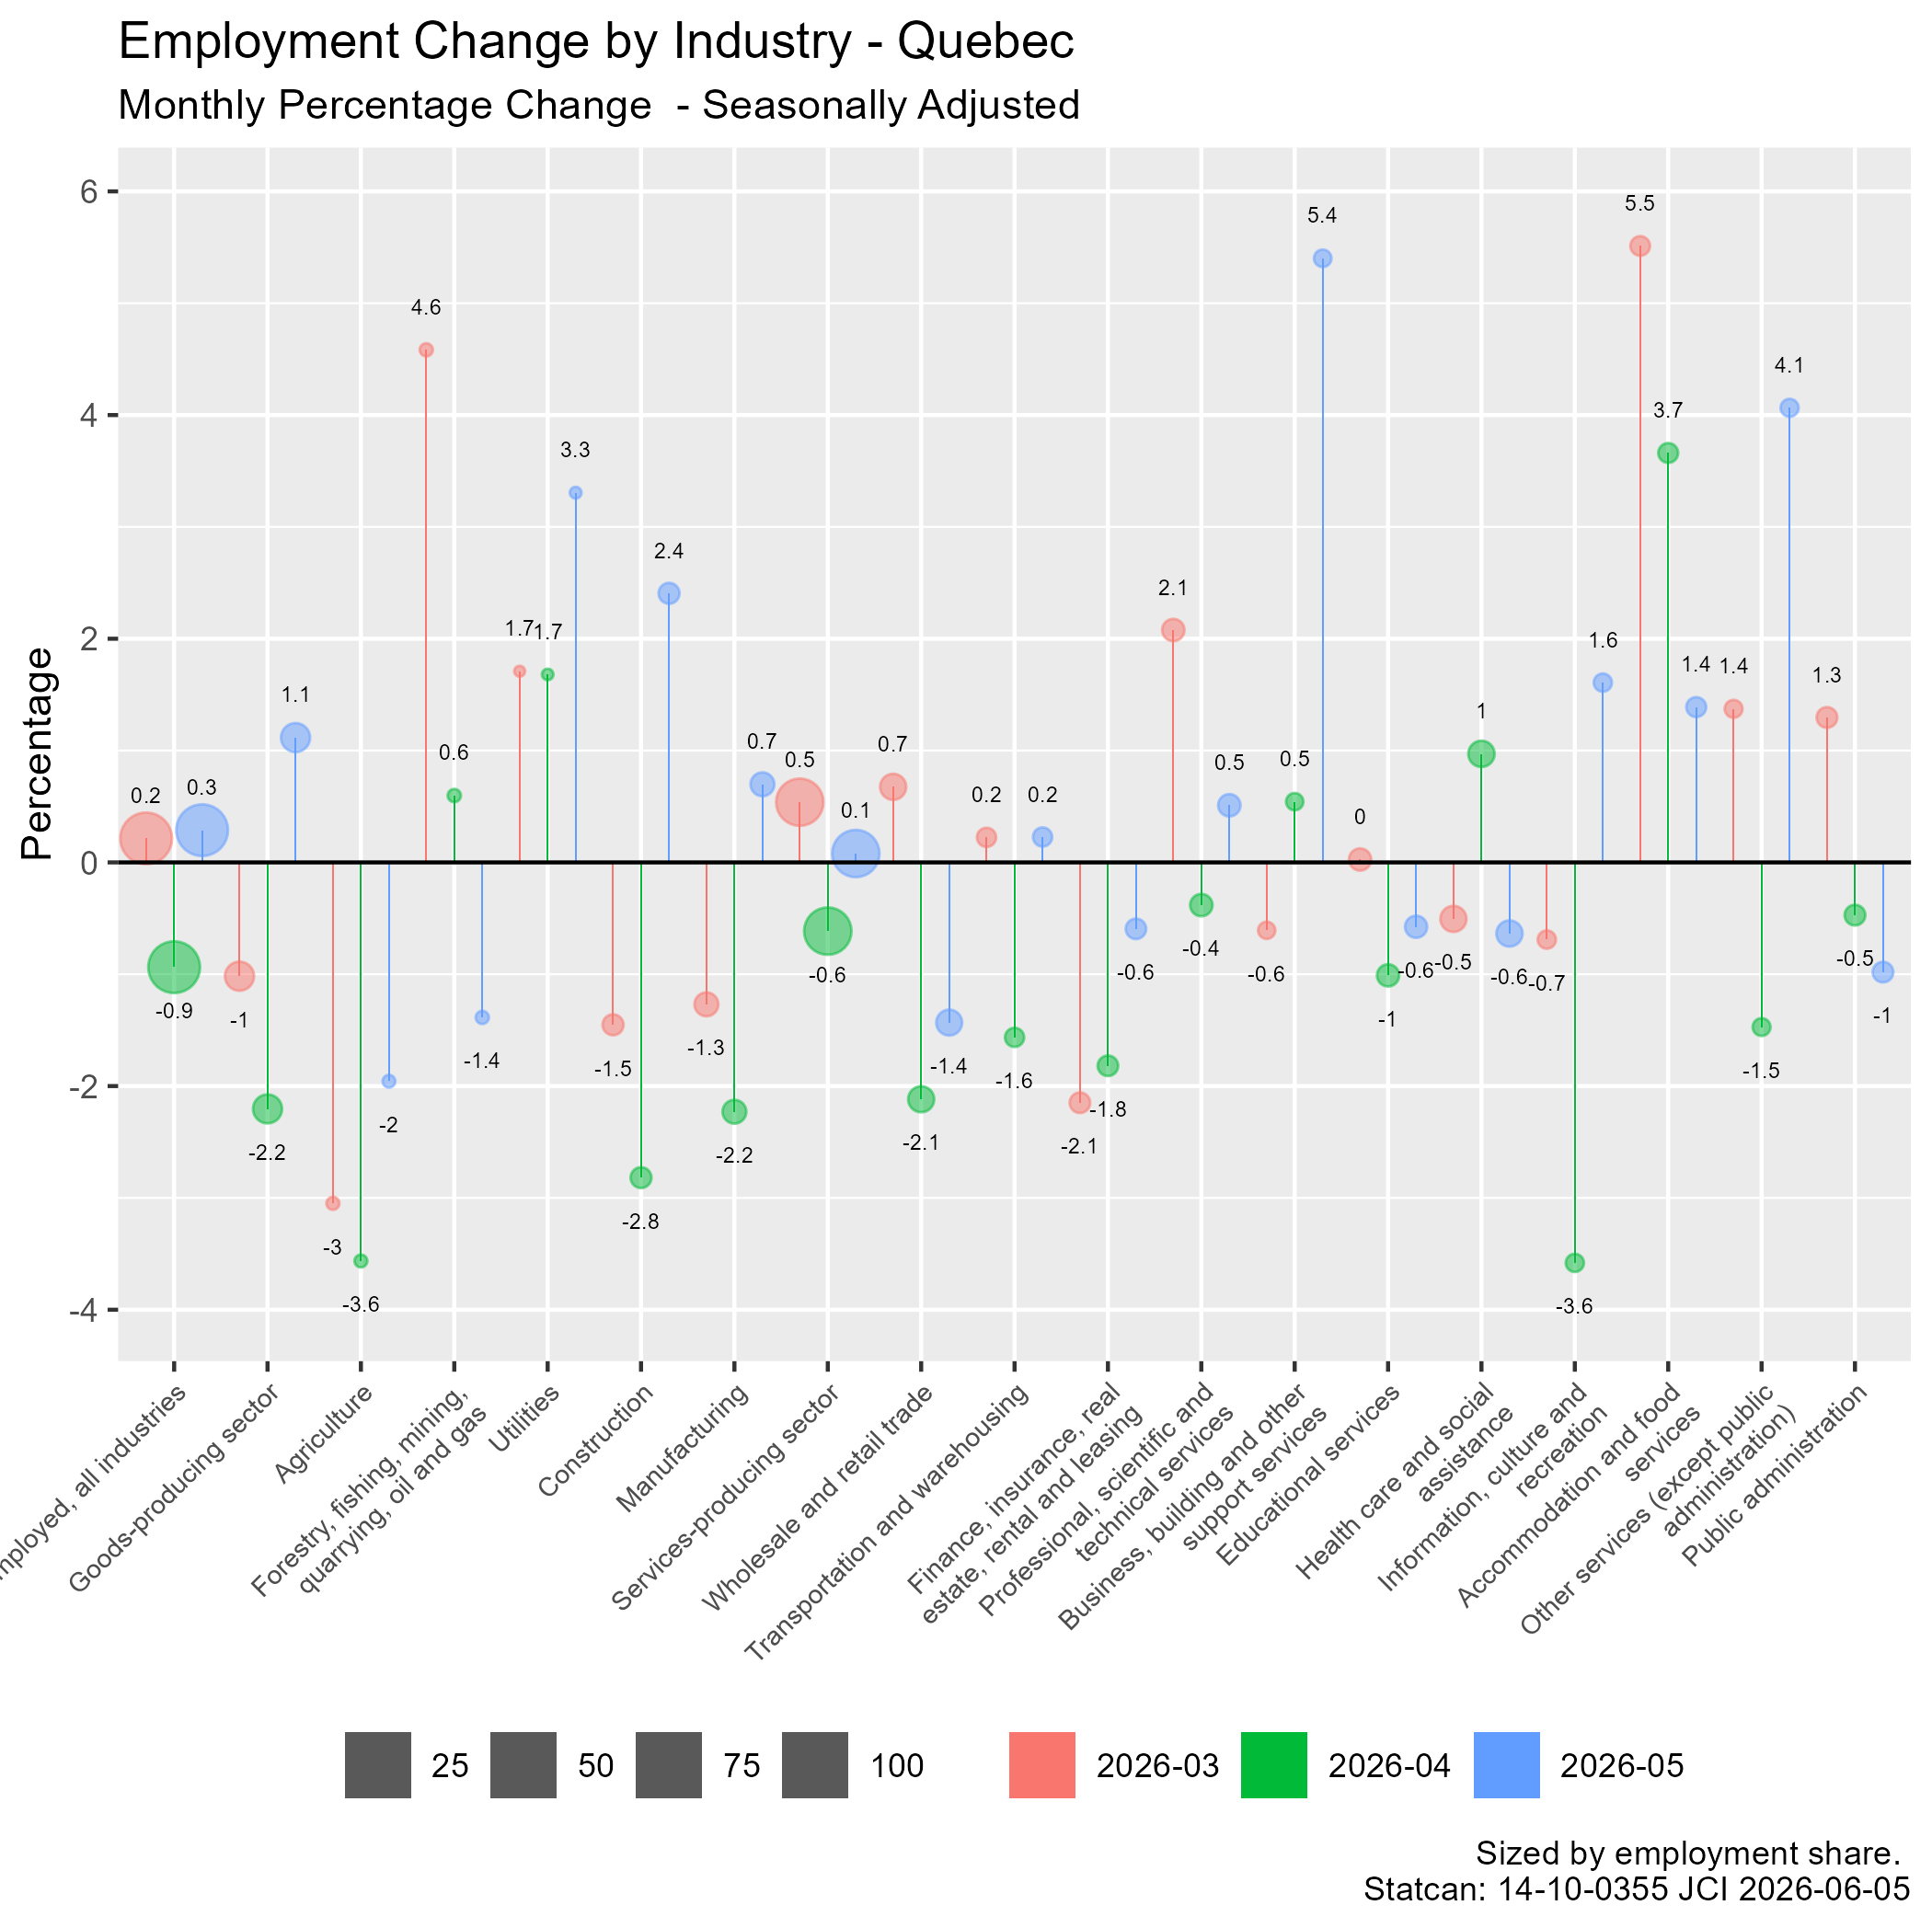
It is useful to compare the non-business sectors in the our two largest provinces. In these sectors, QC is arguably weaker than ON. Broad-based headlines about economic recession are difficult to sustain in the face of such differences.
Regional issues
Comparing the trend in the larger provinces shows the big challenges in the main provinces and the energy-related growth in “alienated” AB.


The key point is that the aggregate does not tell as much as the detail. Labour markets are regionally sensitive to their industrial structure. Construction is very regional and is moving the outlook. The detailed content of the Daily is useful.
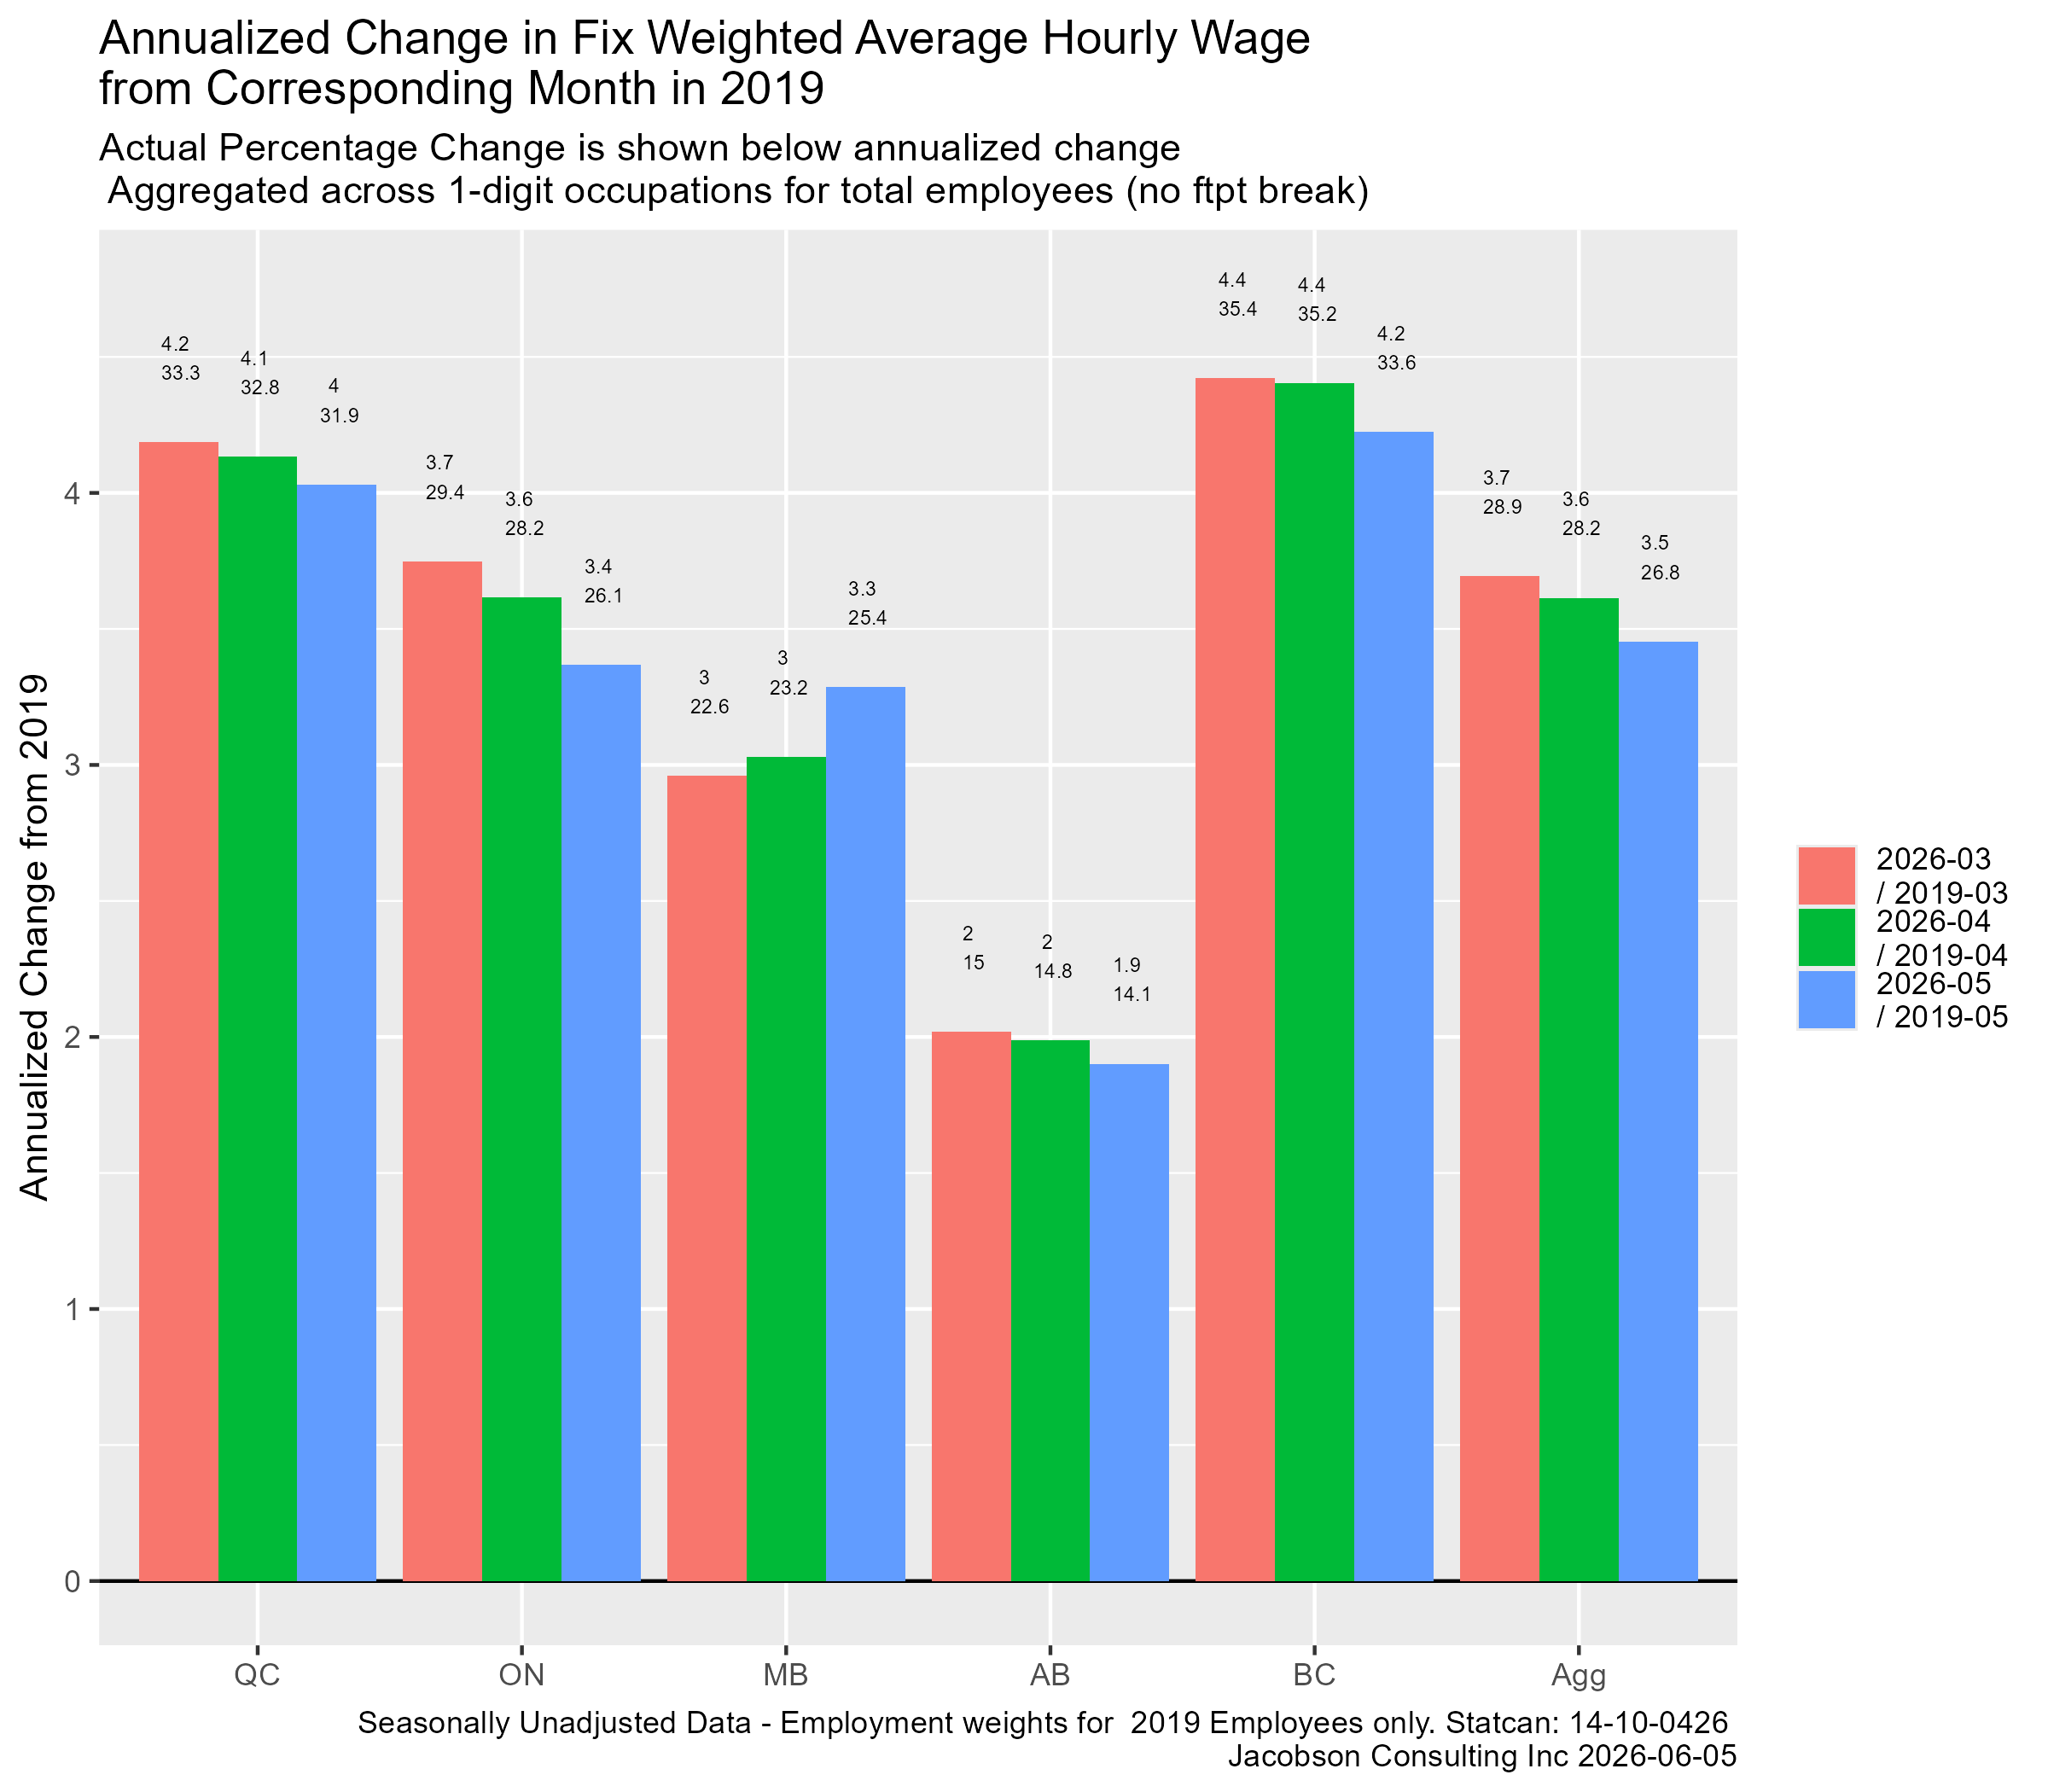
Labour Compensation
The survey nature of the LFS limits the detail that can be usefully extracted. To understand wage movements, I like to use a fix-weighted comparison to stabilize for changes in occupational composition. Because the data are not seasonally adjusted, I do a comparison to the same month in 2019. By my reading wage change is not under pressure.
Detailed Charts
AI is not used. All charts and ideas are the responsibility of Paul Jacobson.