


LFS - Canada & Provinces 2025-02
#employment #canada #provinces #202502

LFS 2025-02
Aggregate employment is going unsurprisingly flat. Policy uncertainty and a slow recovery from monetary over-tightening are working well. The Daily highlights the employment rate because of the immigration-leg population growth but the reality is that economic growth is stalling. The reference week (Feb 9-15) gives us a picture of the impact of uncertainty and policy delays on the state of play in Canada. There is a real kink in the aggregate trend but detail issues have been apparent in many sectors and regions throughout the fall.

By industry, monthly growth is more downs than ups. This is a stall.

My LFS tentacle charts use the trend-cycle component (red, green in the first chart) to show where things are going regionally,
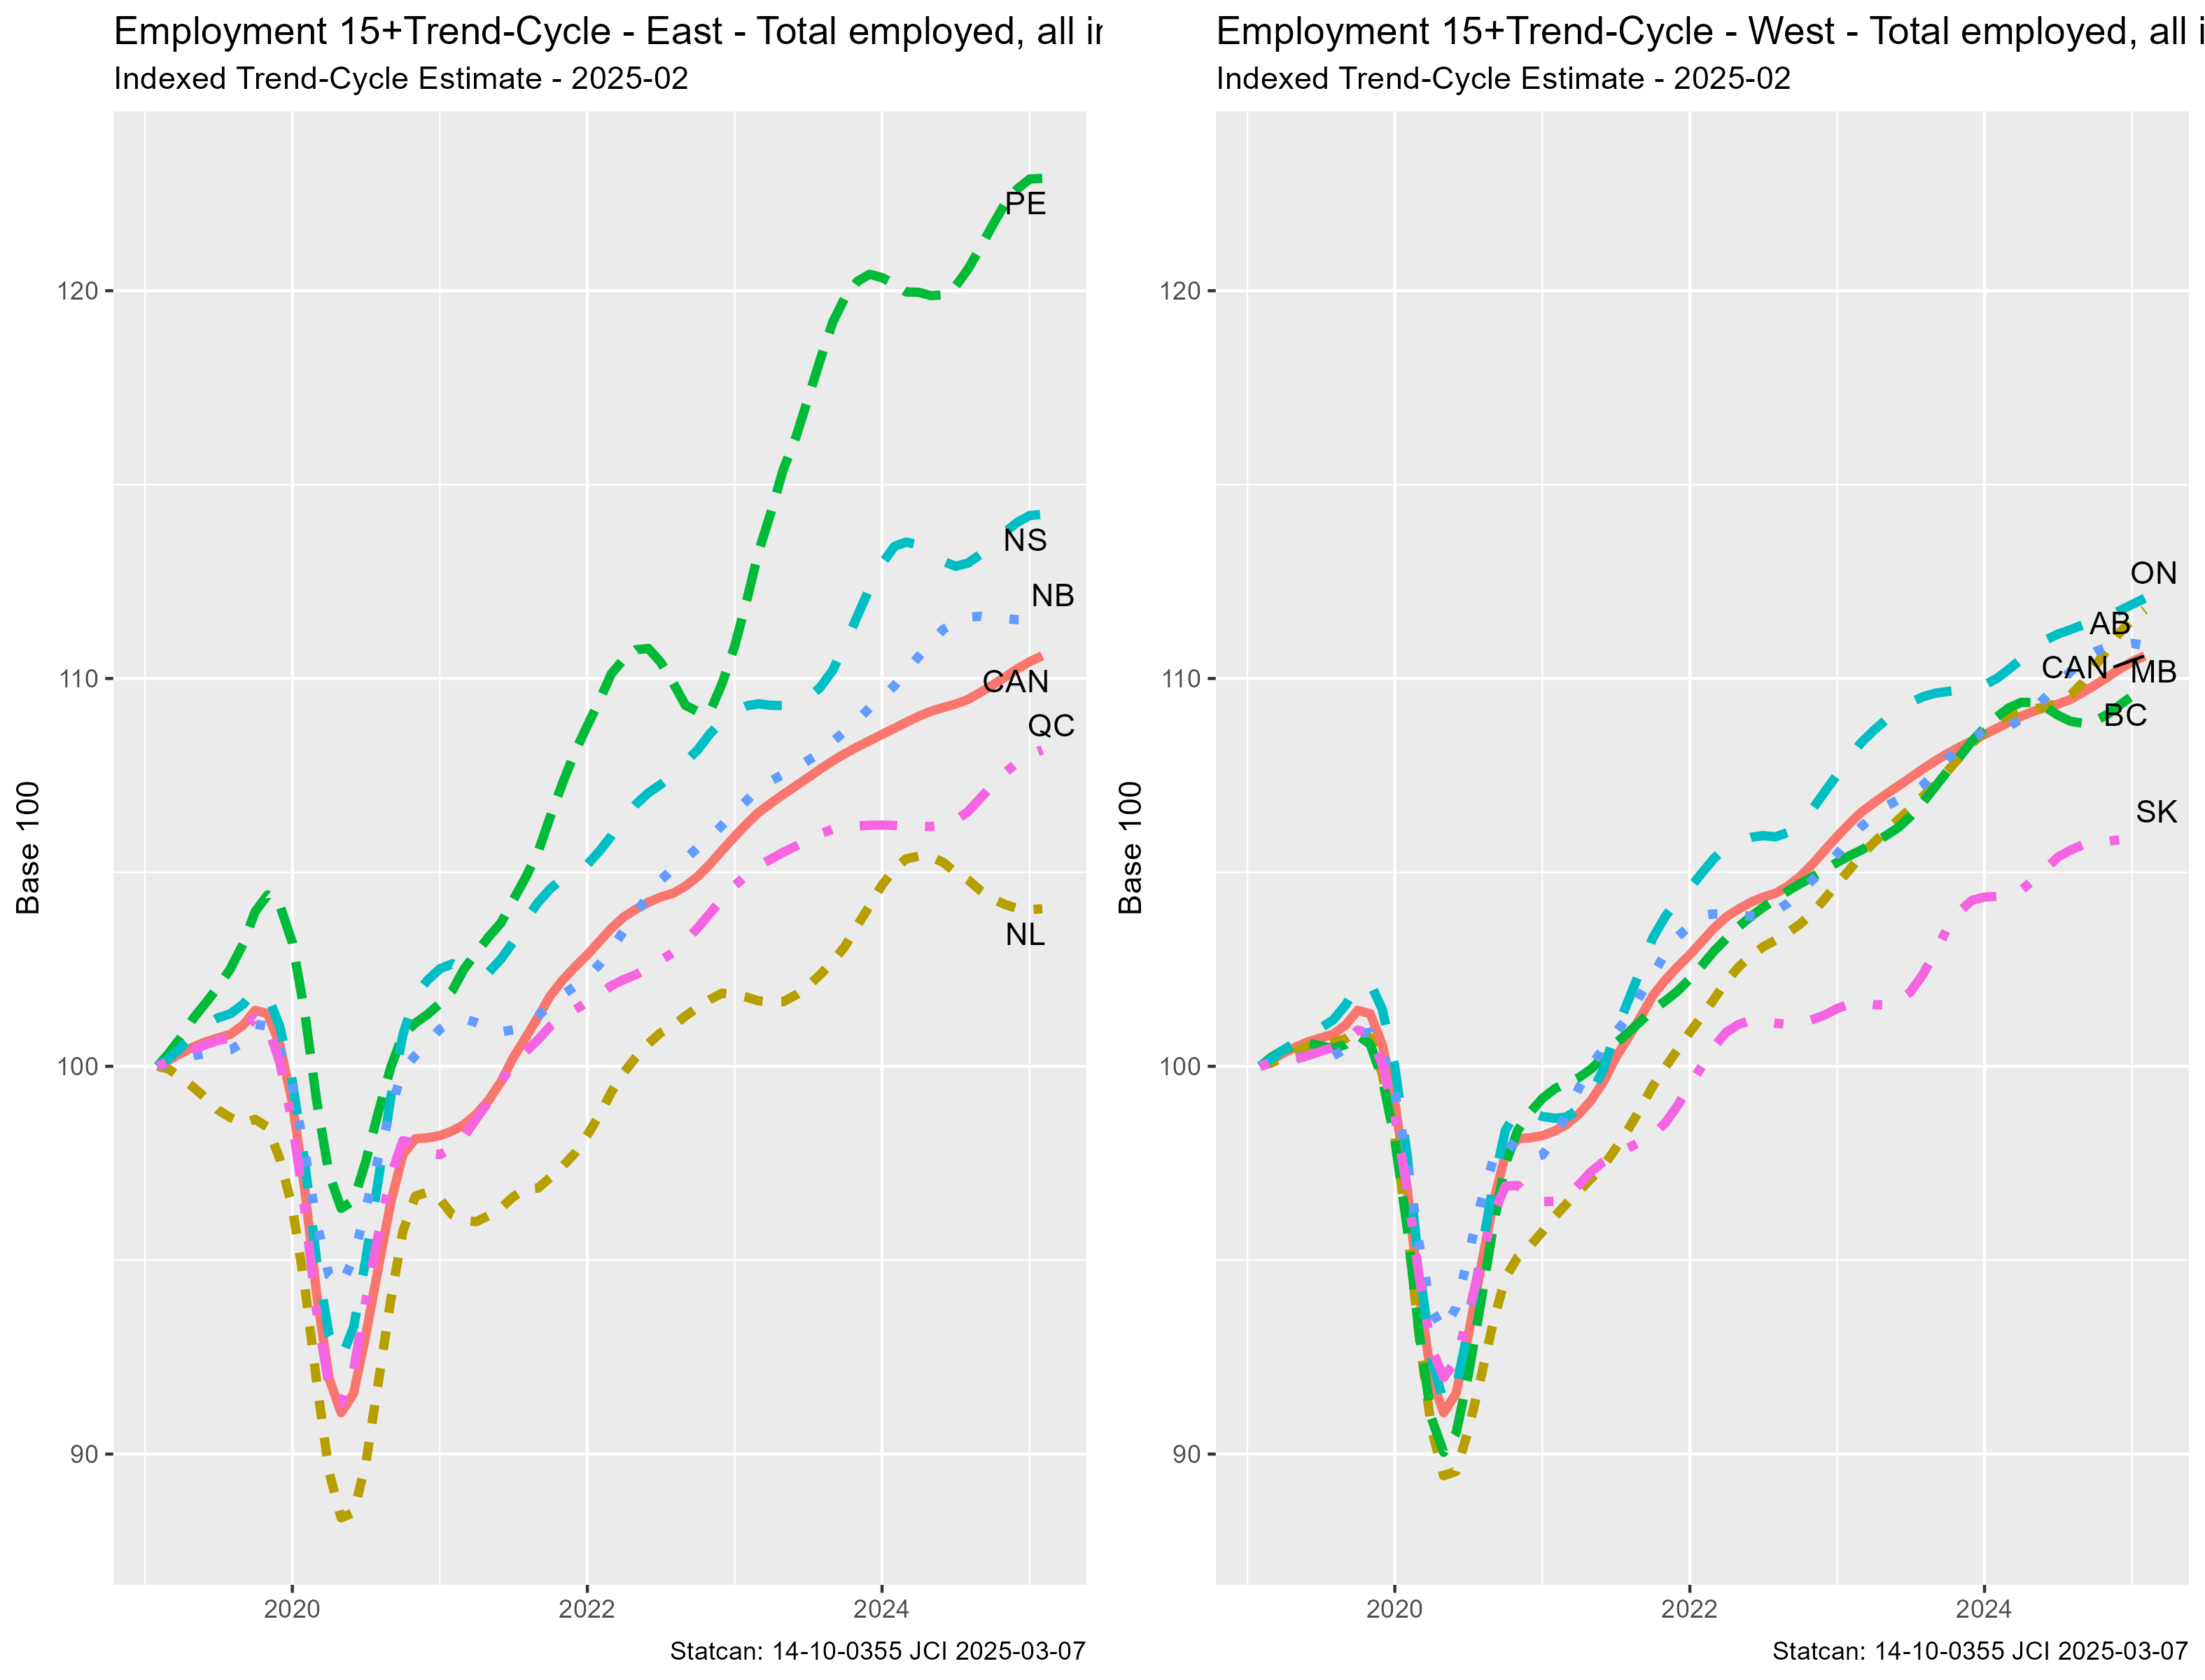
As well as the regional disparities, the charts highlight the slower growth in QC and SK as well as the weakened picture in BC.
In provincial terms, only ON has much momentum.

The discrepancy between full- and part-time by region reflects the underlying differences in industrial activity. Full-time workers are not doing as well in ON.
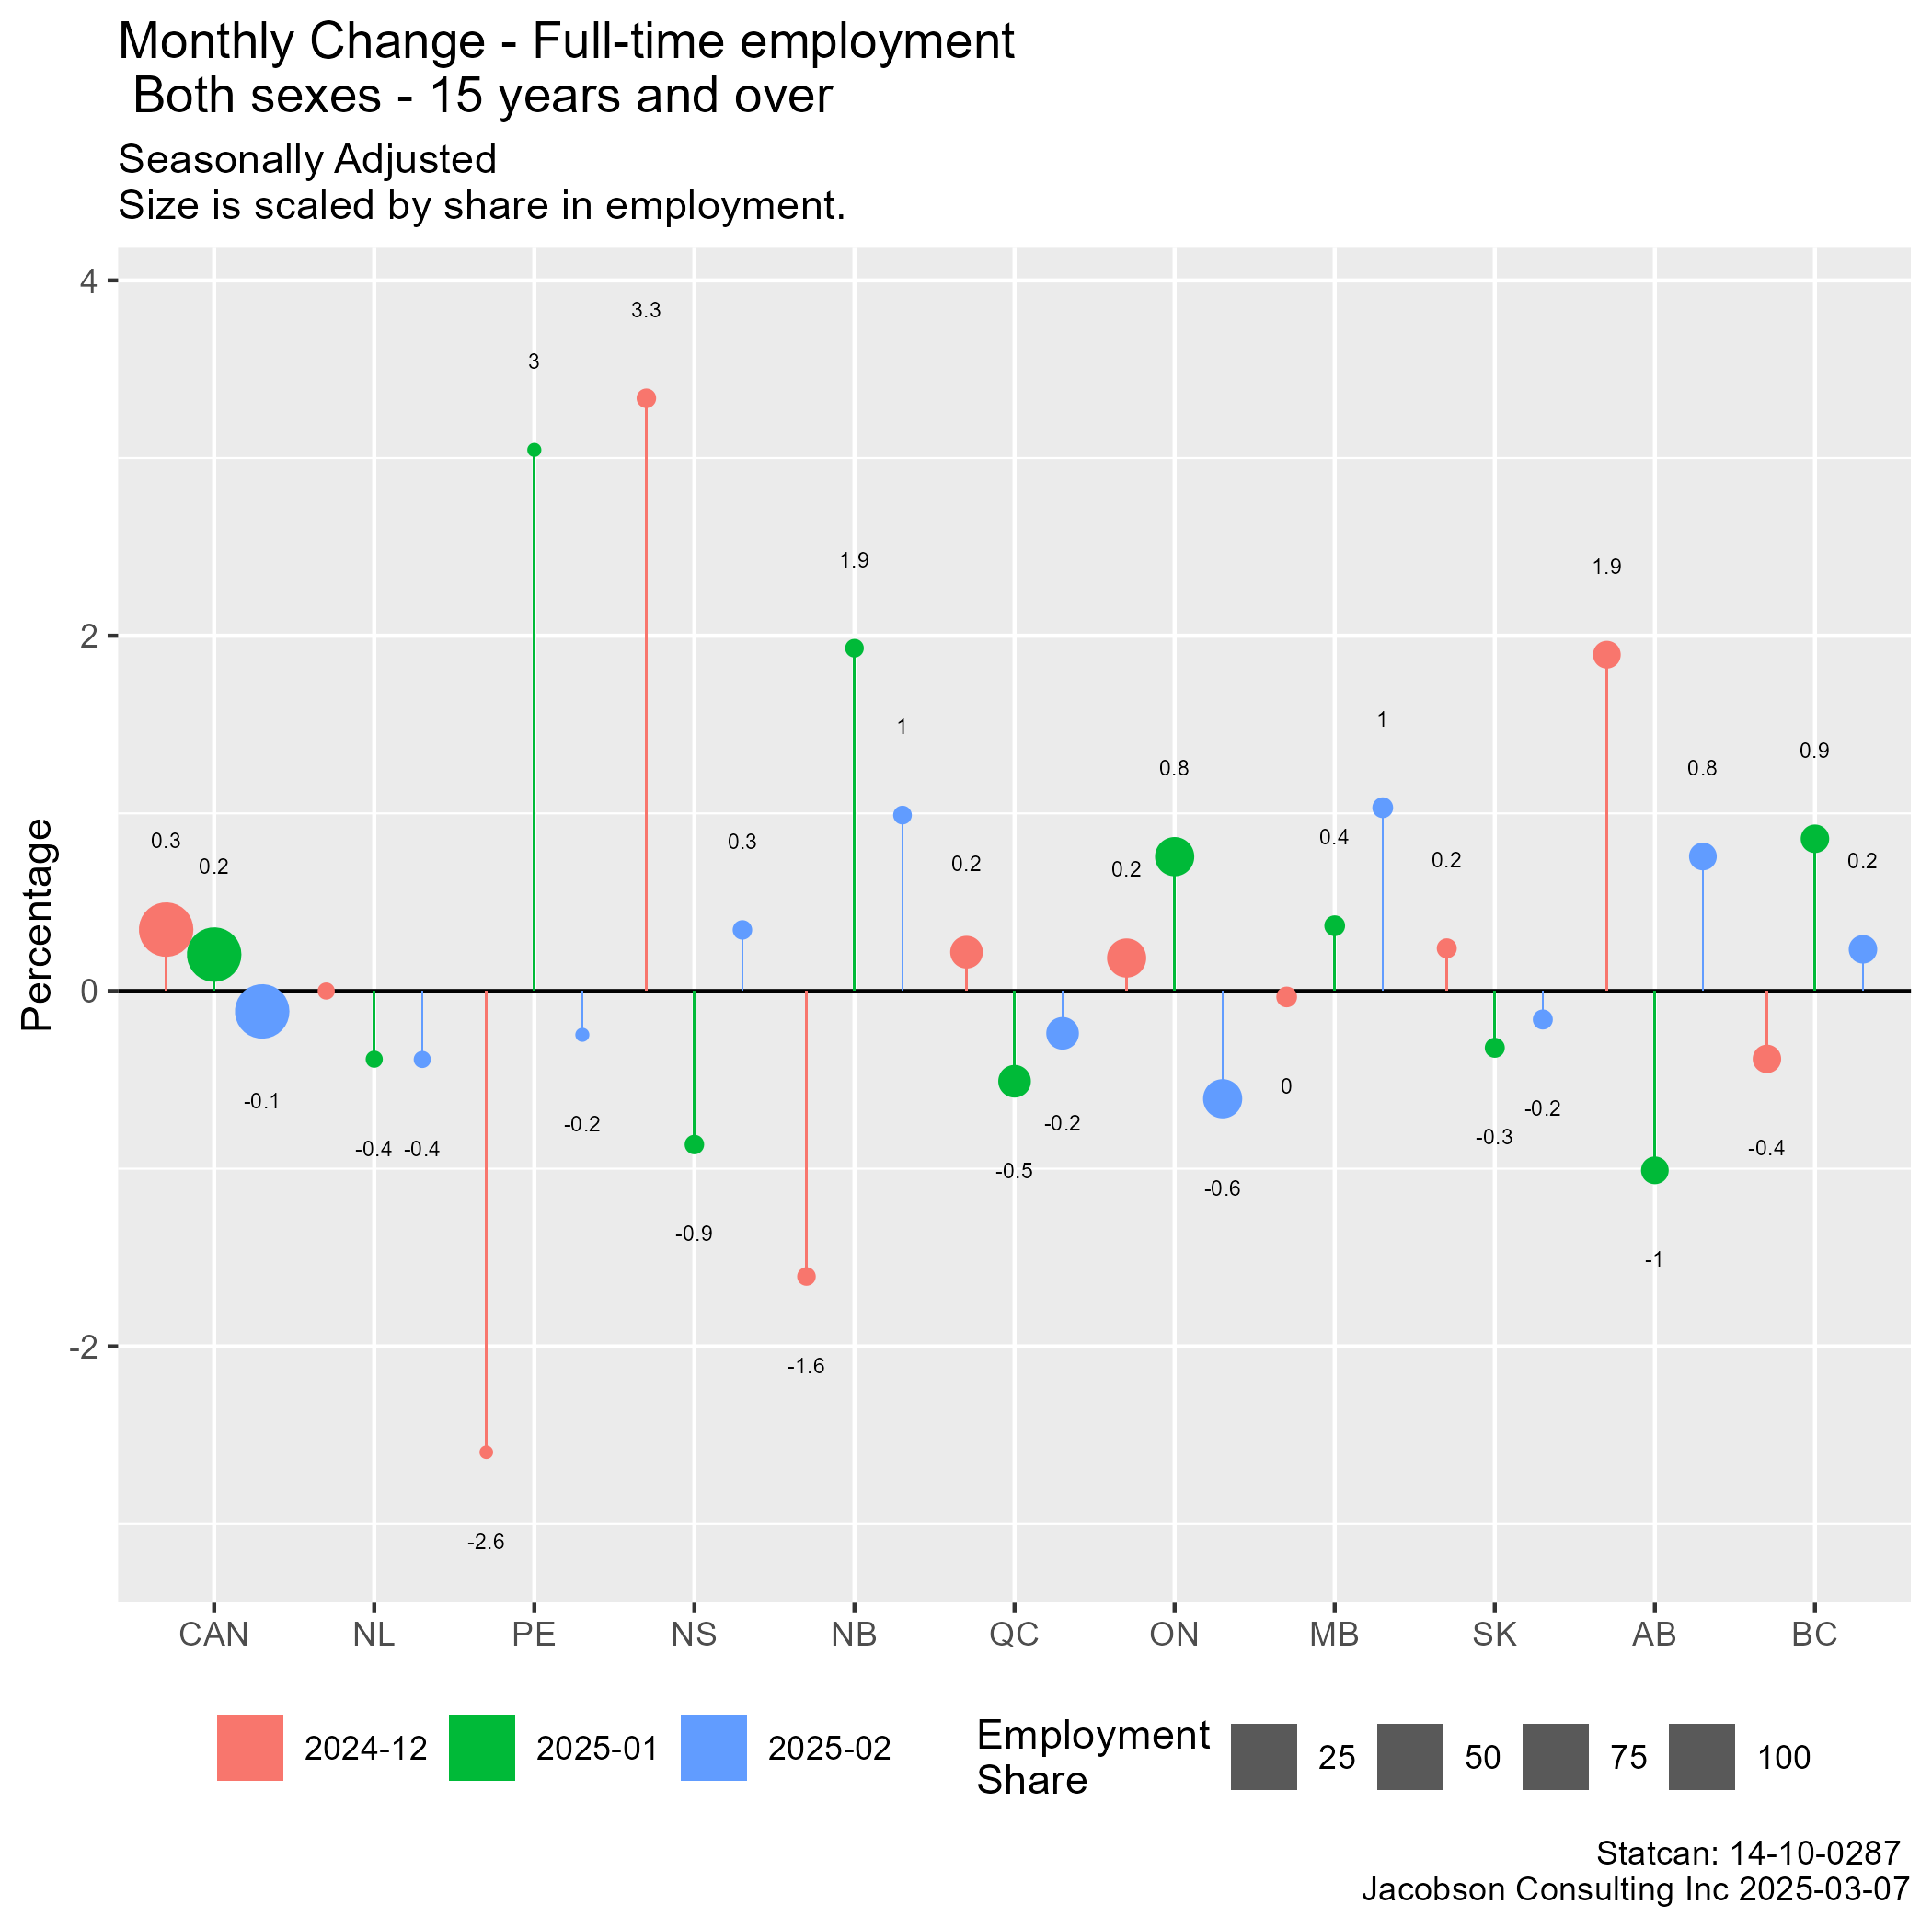

If not for growth in part-time work, the aggregate would be even weaker.
Male employment growth is not strong. Female employment in QC has been weakening.


Large Province Industry
Quebec

In QC, construction employment dropped substantially (-3.2%) offsetting the previous month’s gain of 2.4%. Accommodation and food services employment dropped back -3.7%. As in most provinces, things are just wiggling.
Ontario

In ON, employment in the finance sector rose by 1.5% offsetting the drop of -1.4% in January. Educational services continued a decline of -0.5%. Public administration had another drop of -0.3% to add on to the decline of -0.5% in January. The bright note is growth of 1.3% in the manufacturing employment in both January and February.
Alberta

The shift to stall is very obvious in AB. The gain in construction of 2.6% does not offset the manufacturing drop of -4.4%. Employment in Health and Social services continues to slide with a drop of -1.6%.
British Columbia
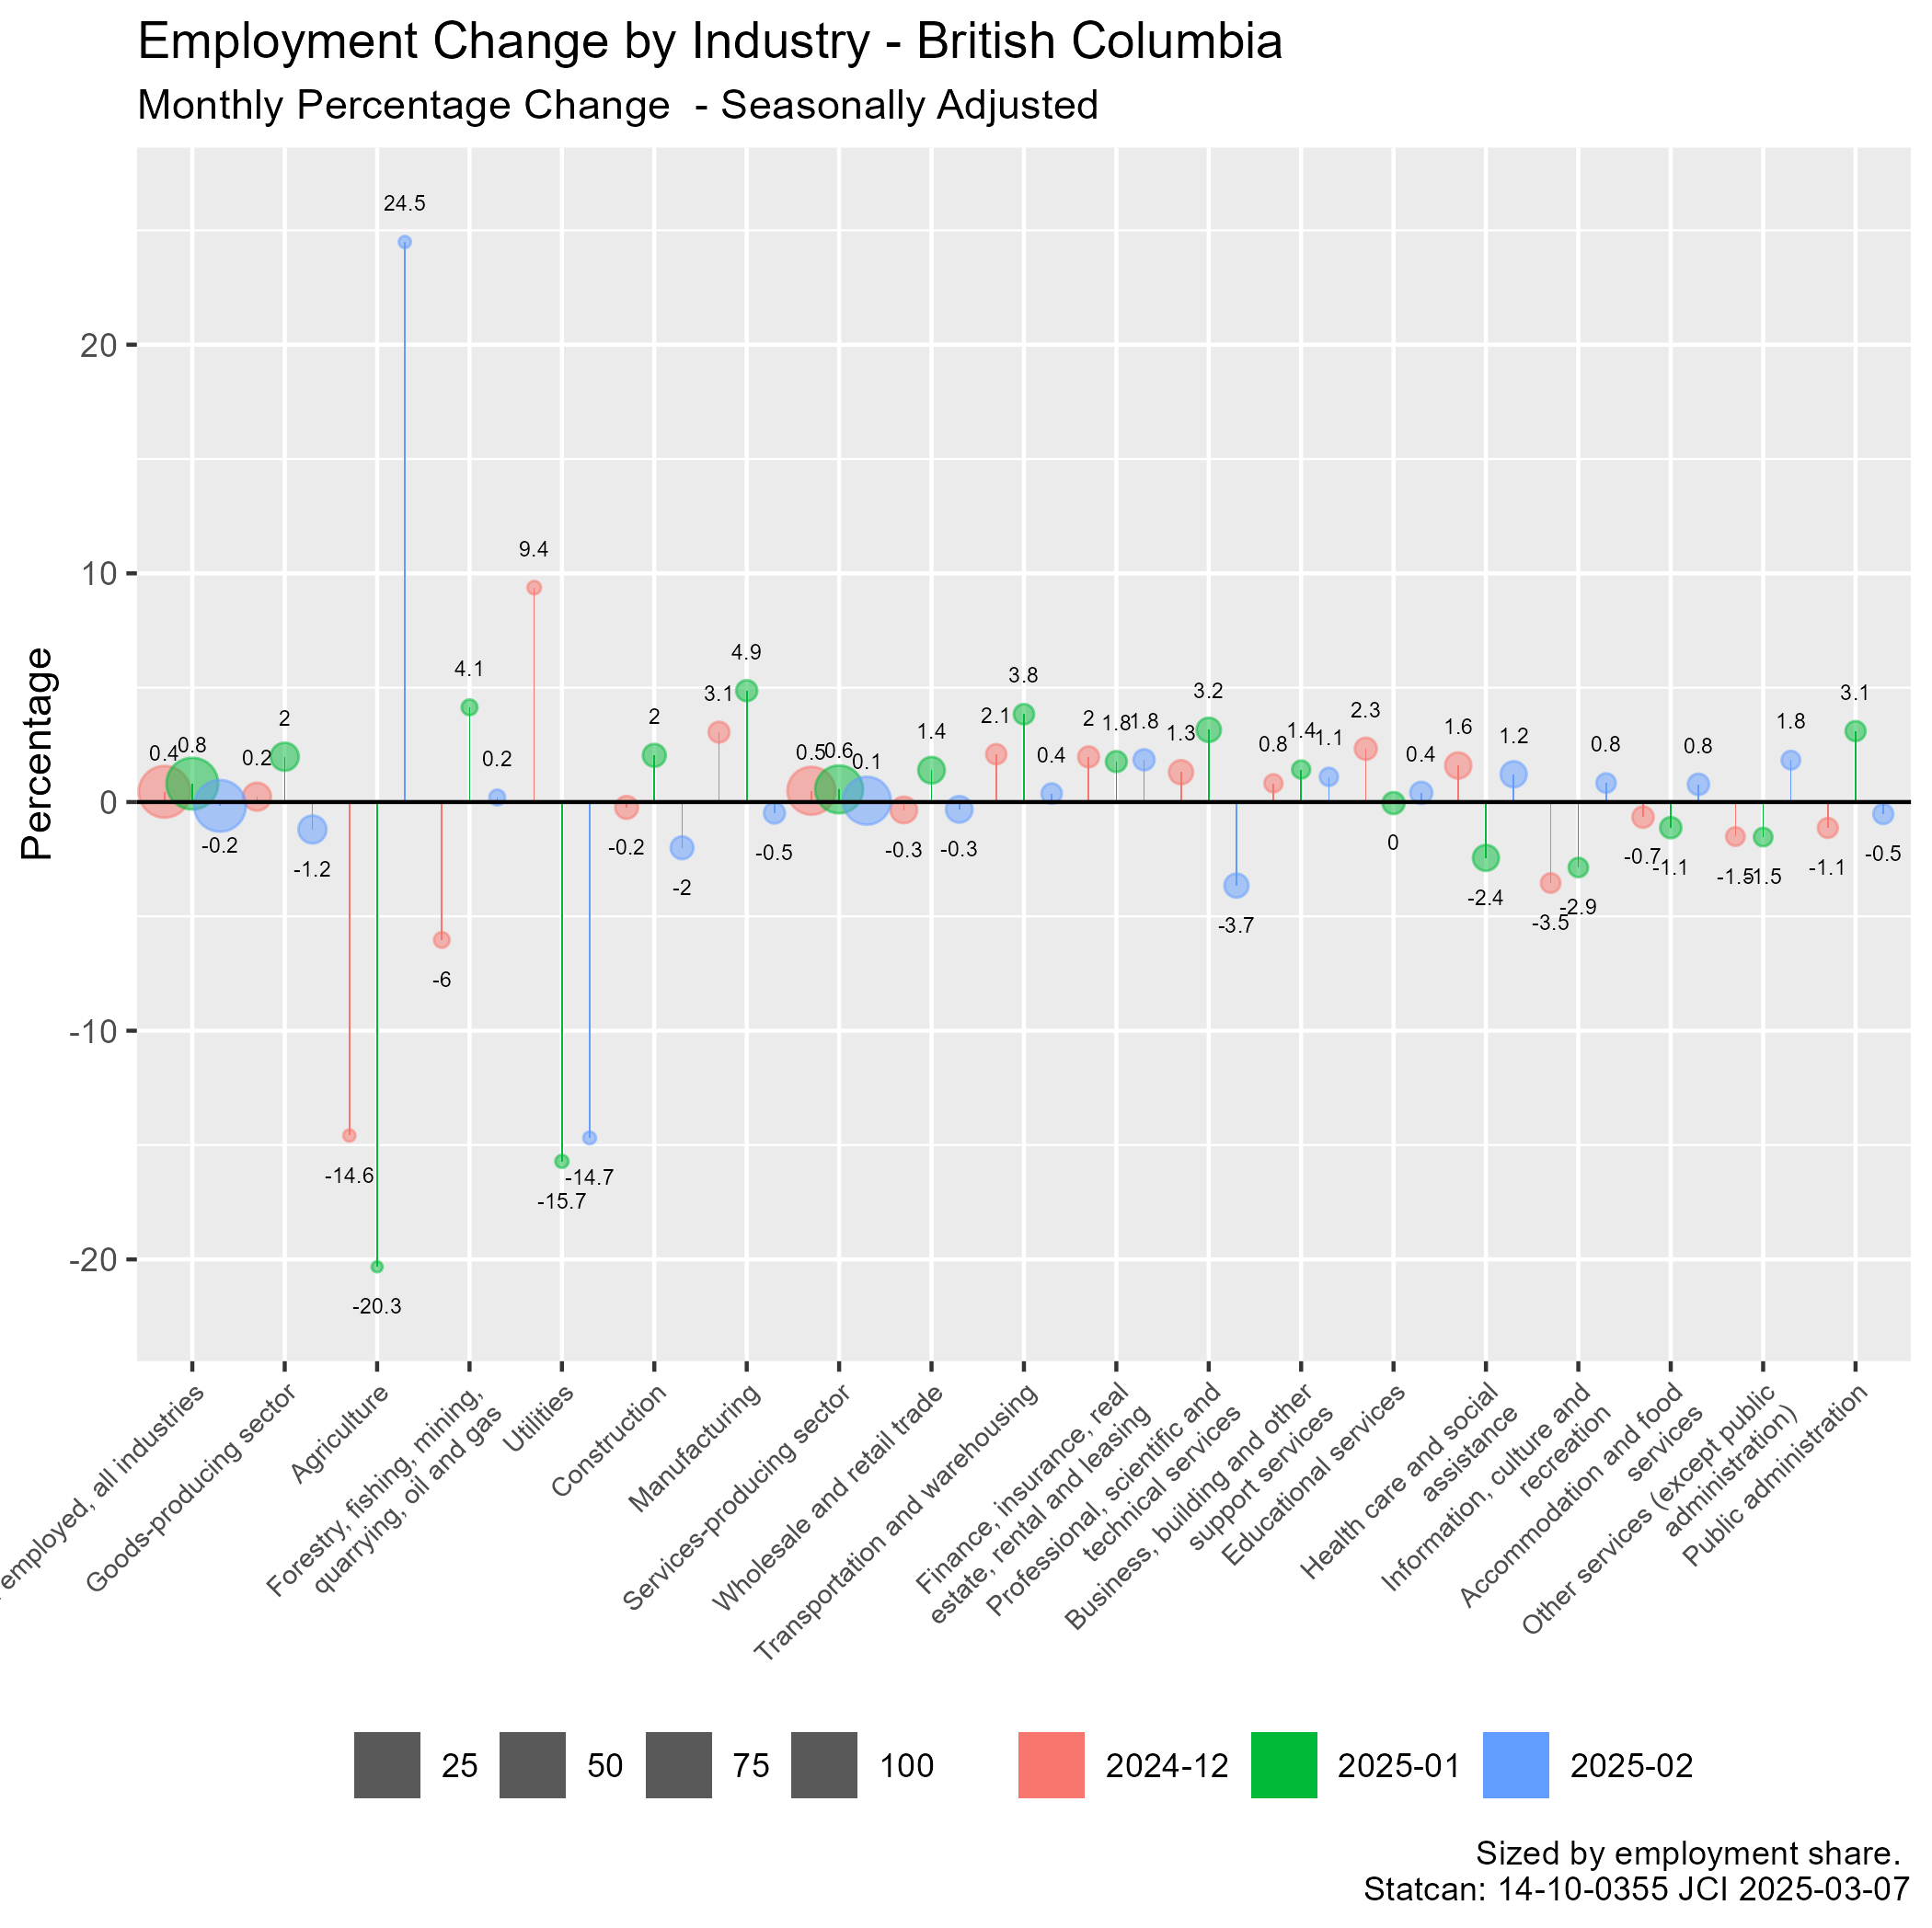
in BC, churn is probably the best adjective. The continuation of declines in the utilities sector (project completion) and churn in construction keep a damper on things. A relatively large drop of -3.7% in the professional services sector offsets past growth.
Summary
The economy has really been in slow stall mode for the last few months. Recovery in some sectors from shutdowns helped to mask the underlying malaise. My major concern is the lack of incentive to invest, driven by high interest rates, and policy uncertainty may have clouded our future.
Detailed Charts
The detailed charts include trend charts for all the provinces and comparisons to the 2020-02 benchmark and well as lots of wage and gender analysis.
AI not used, charts and ideas by Paul Jacobson
https://www.jacobsonconsulting.com/jci_site/index.php/downloads-2/labour-force-charts-data-ending-2025-02/viewdocument/604