

Employment - Flat aggregate
Employment - Flat aggregate
Lots of moving parts in the picture but no fire

#employment #canada #provinces #2023-05 - Employment is not moving much at the aggregate but labour is local. Looking over the last 3 months, provincial bounces are significant. This does not look like a fire that needed the BoC attack on Wednesday which seems (IMHO) to be a triumph of dogma over data.
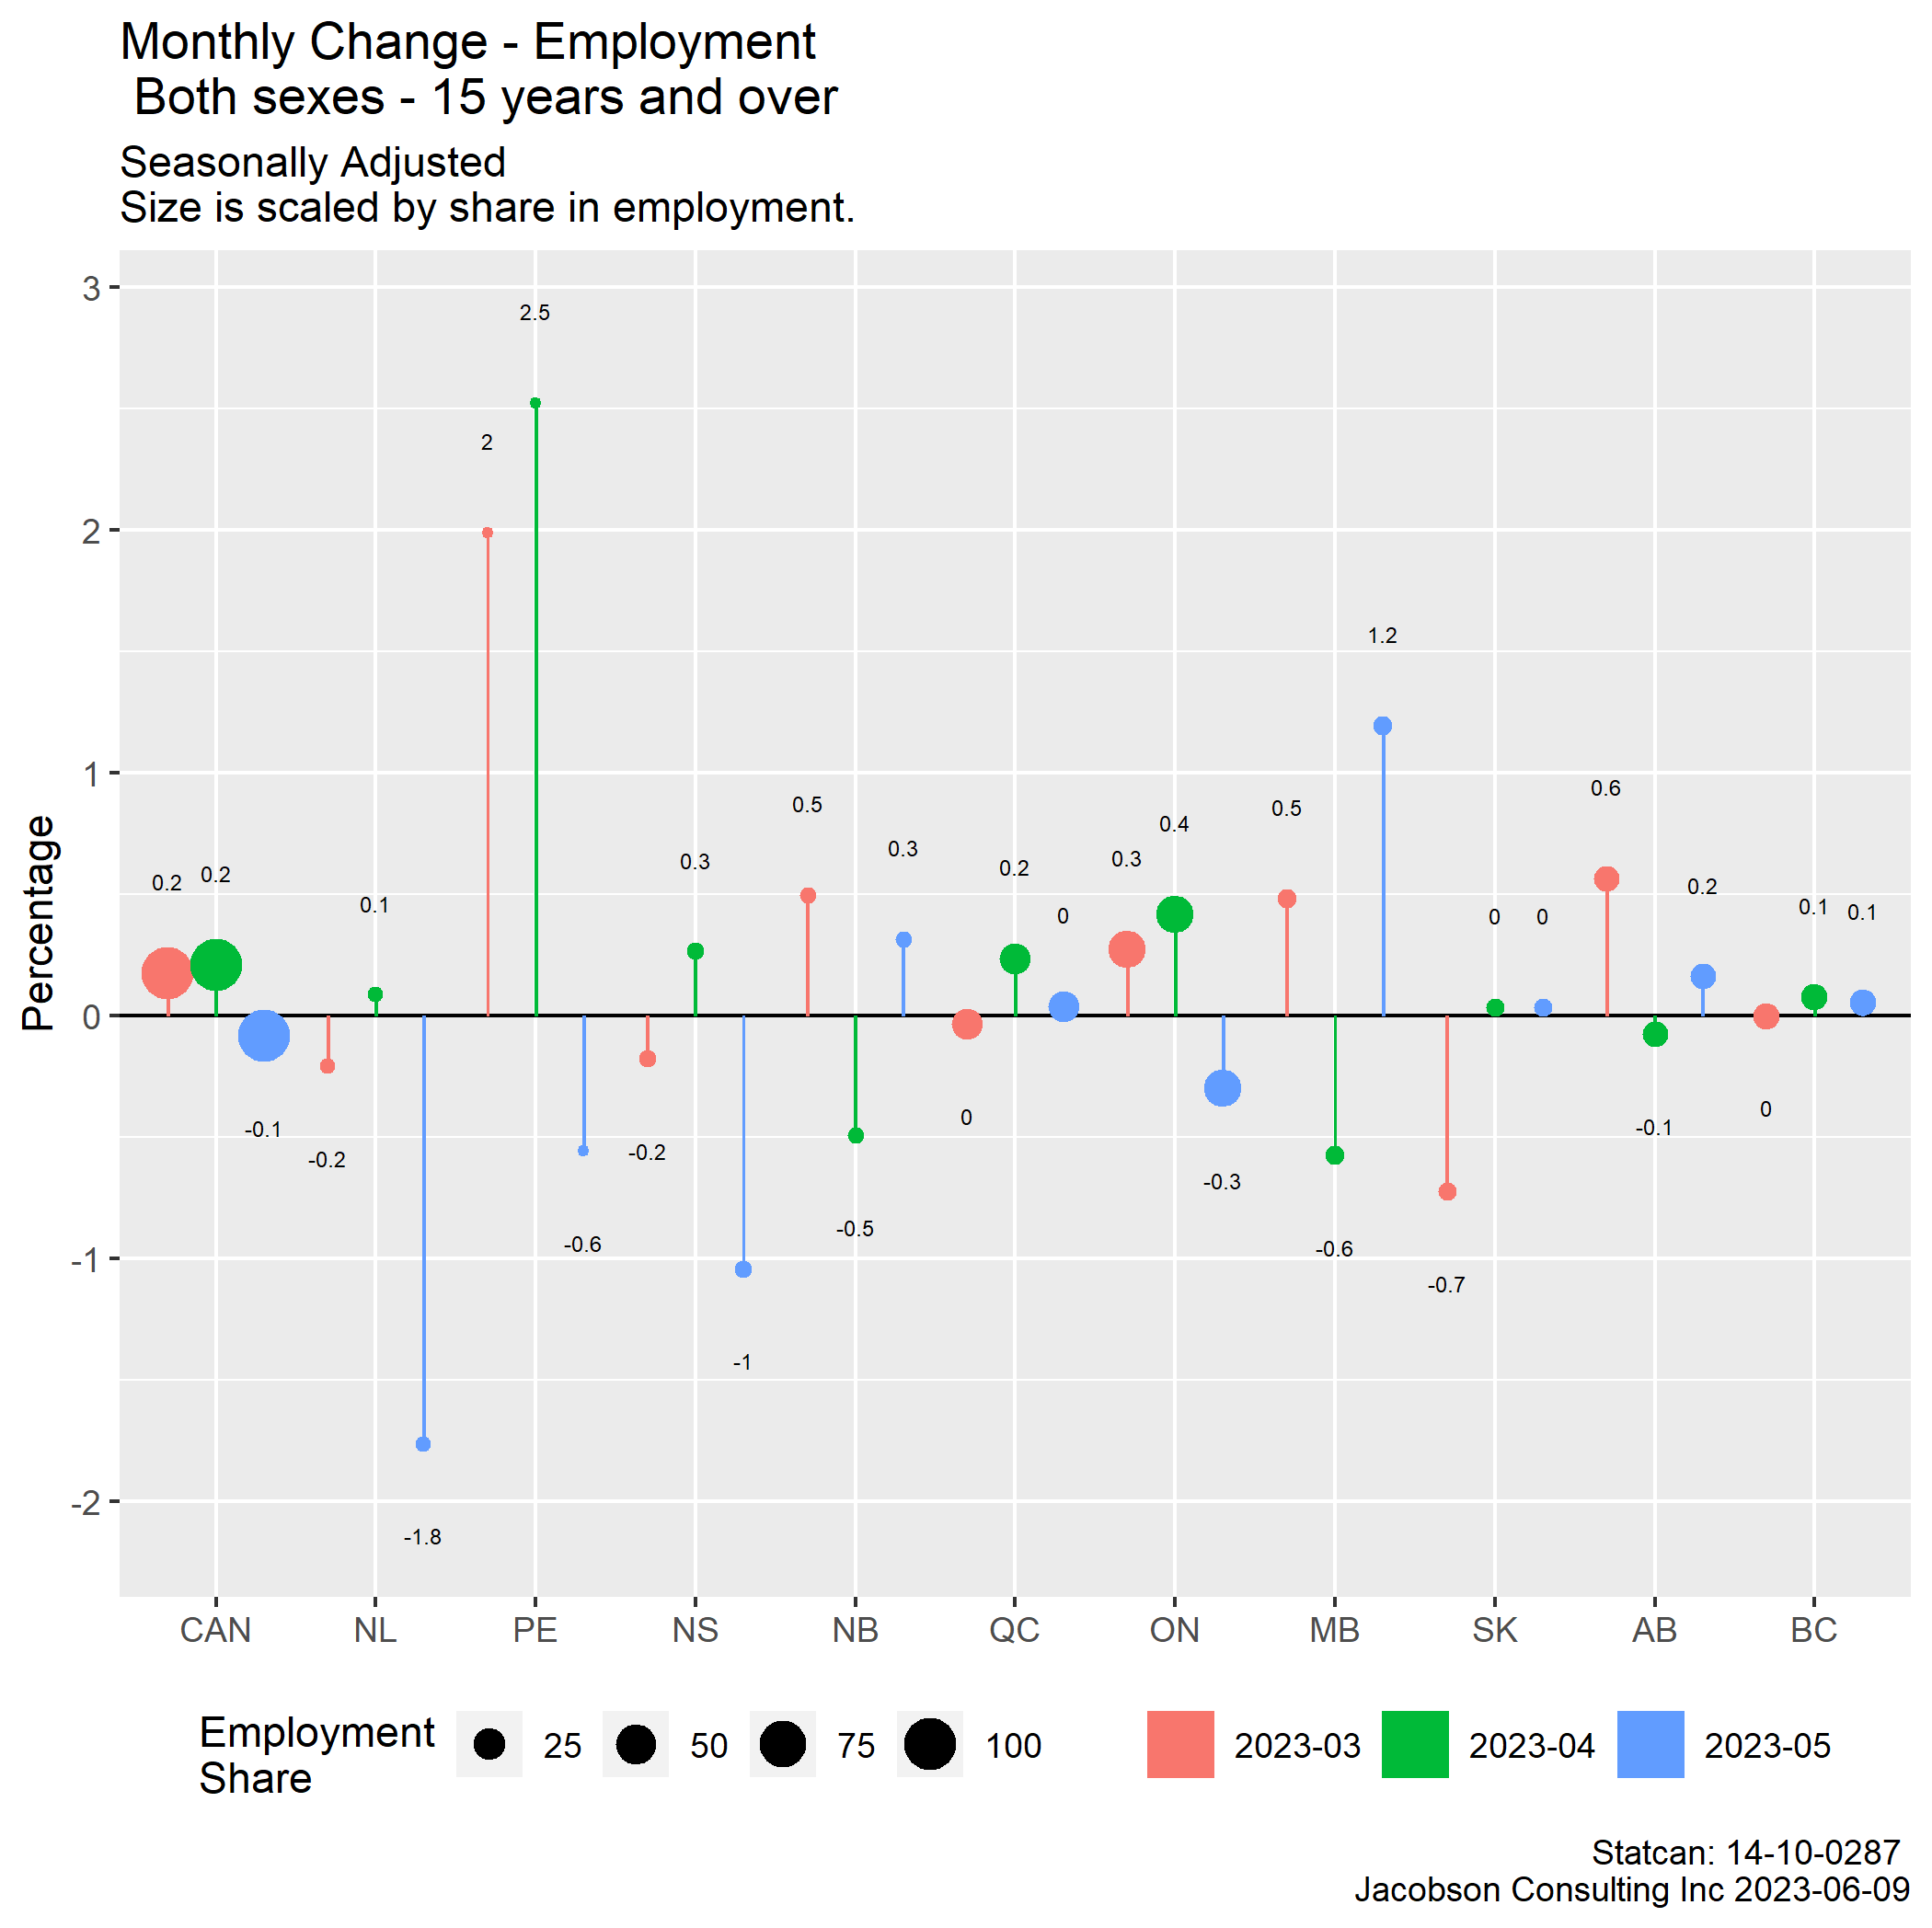
The downdraft in ON and weakness in QC and BC do not define an overheated economy.
Across the country, even trade and health employment are weakening.
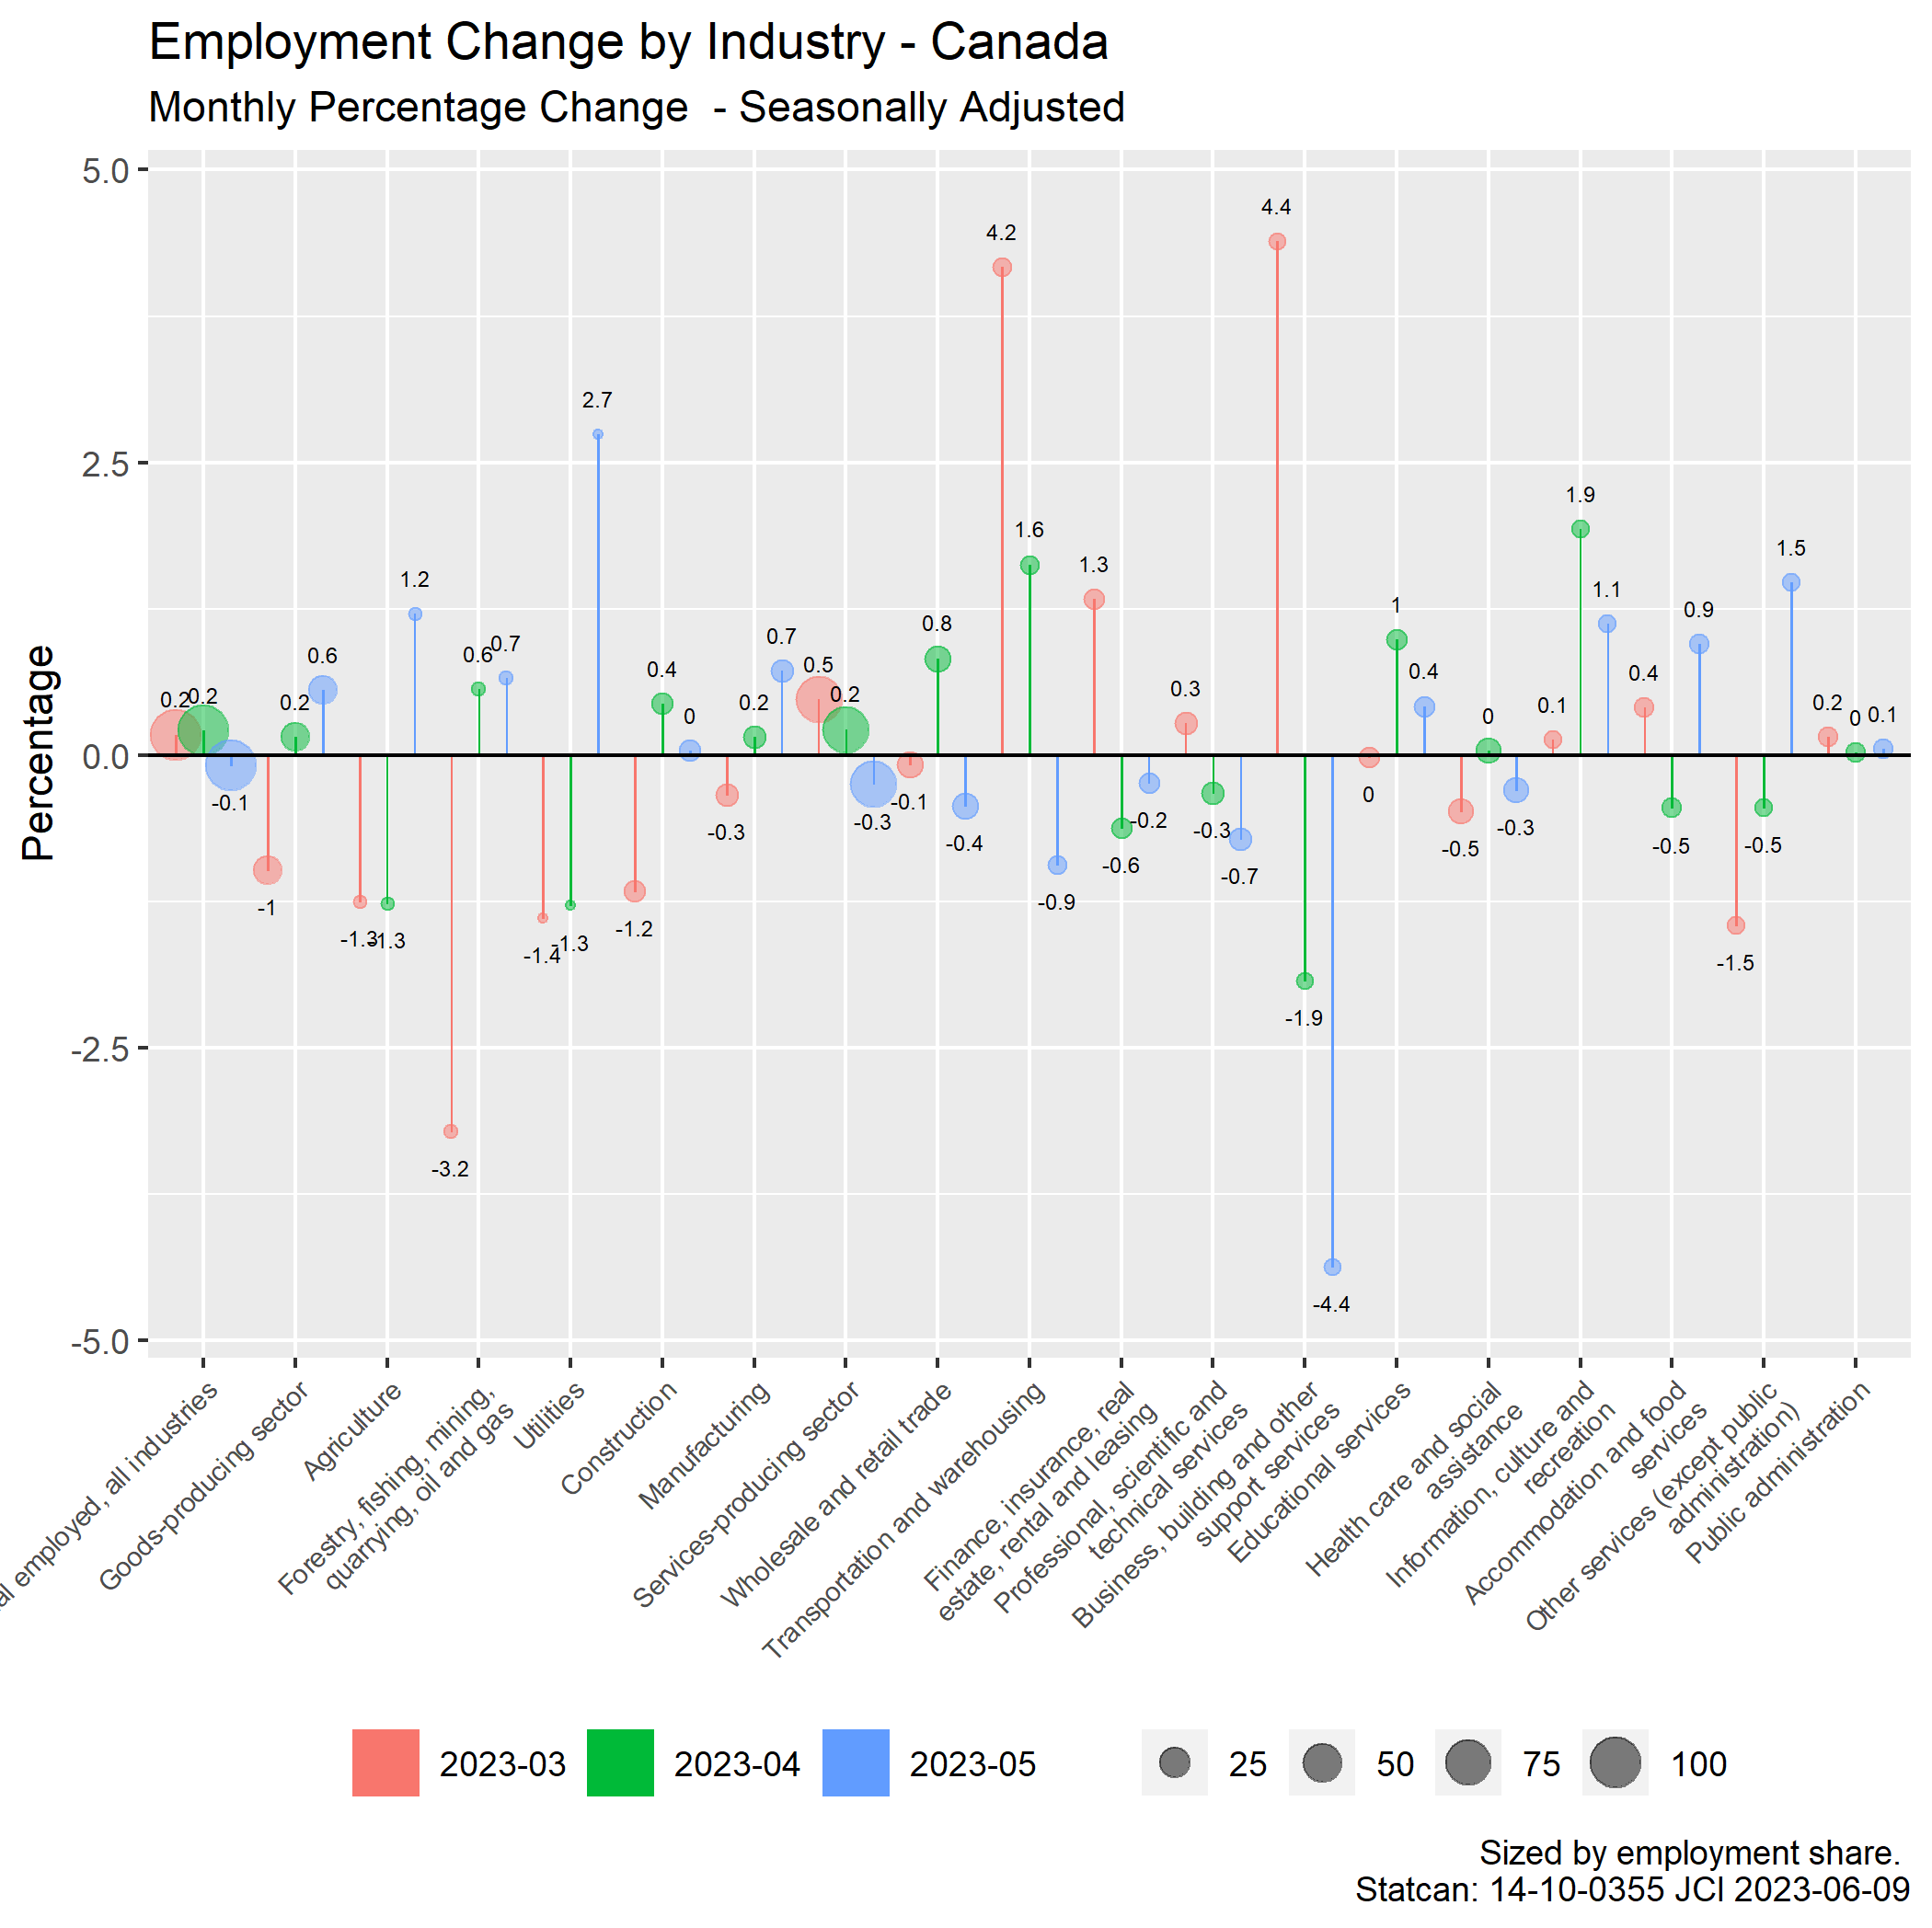
The drop in employment in Building and business services (-4.4%) for the month by reflect restart issues.
The indexed trends show a picture which is not charging ahead. The large-province trends are weak (ON, QC, BC). The restart seems to have brought aggregates roughly back to where they would have been without the shutdown.

Ontario provides a good case in point. The restart was rocky and has stopped.


Click on the charts for a better view. The ON employment change chart (p94) shows downturns in most service sectors. The Business support services downturn may reflect the stuttering return to work in the larger cities. Note the decline of -1.4% in Health care and social services.
Full-time employment gains have weakened in most provinces over the last 3 months.


For full-time workers, annual employment gains have weakened by roughly 1 percentage point in the larger provinces. Gains drop from 2.6% (2023-04) to 1.7% in the May reference week.
The gains were stronger for part-time workers. Ontario recorded a swing of roughly 3 percentage points between April and May for part-time workers. This probably reflects the maturing of the restart process.
By gender, the employment gains have been broadly similar across the sectors with public administration being the notable exception (p20).

Not the 30% shift in female employment in public administration.
Analysis by age suggest that employment rates have risen most for prime-age workers (purple bar) since 2020-02.
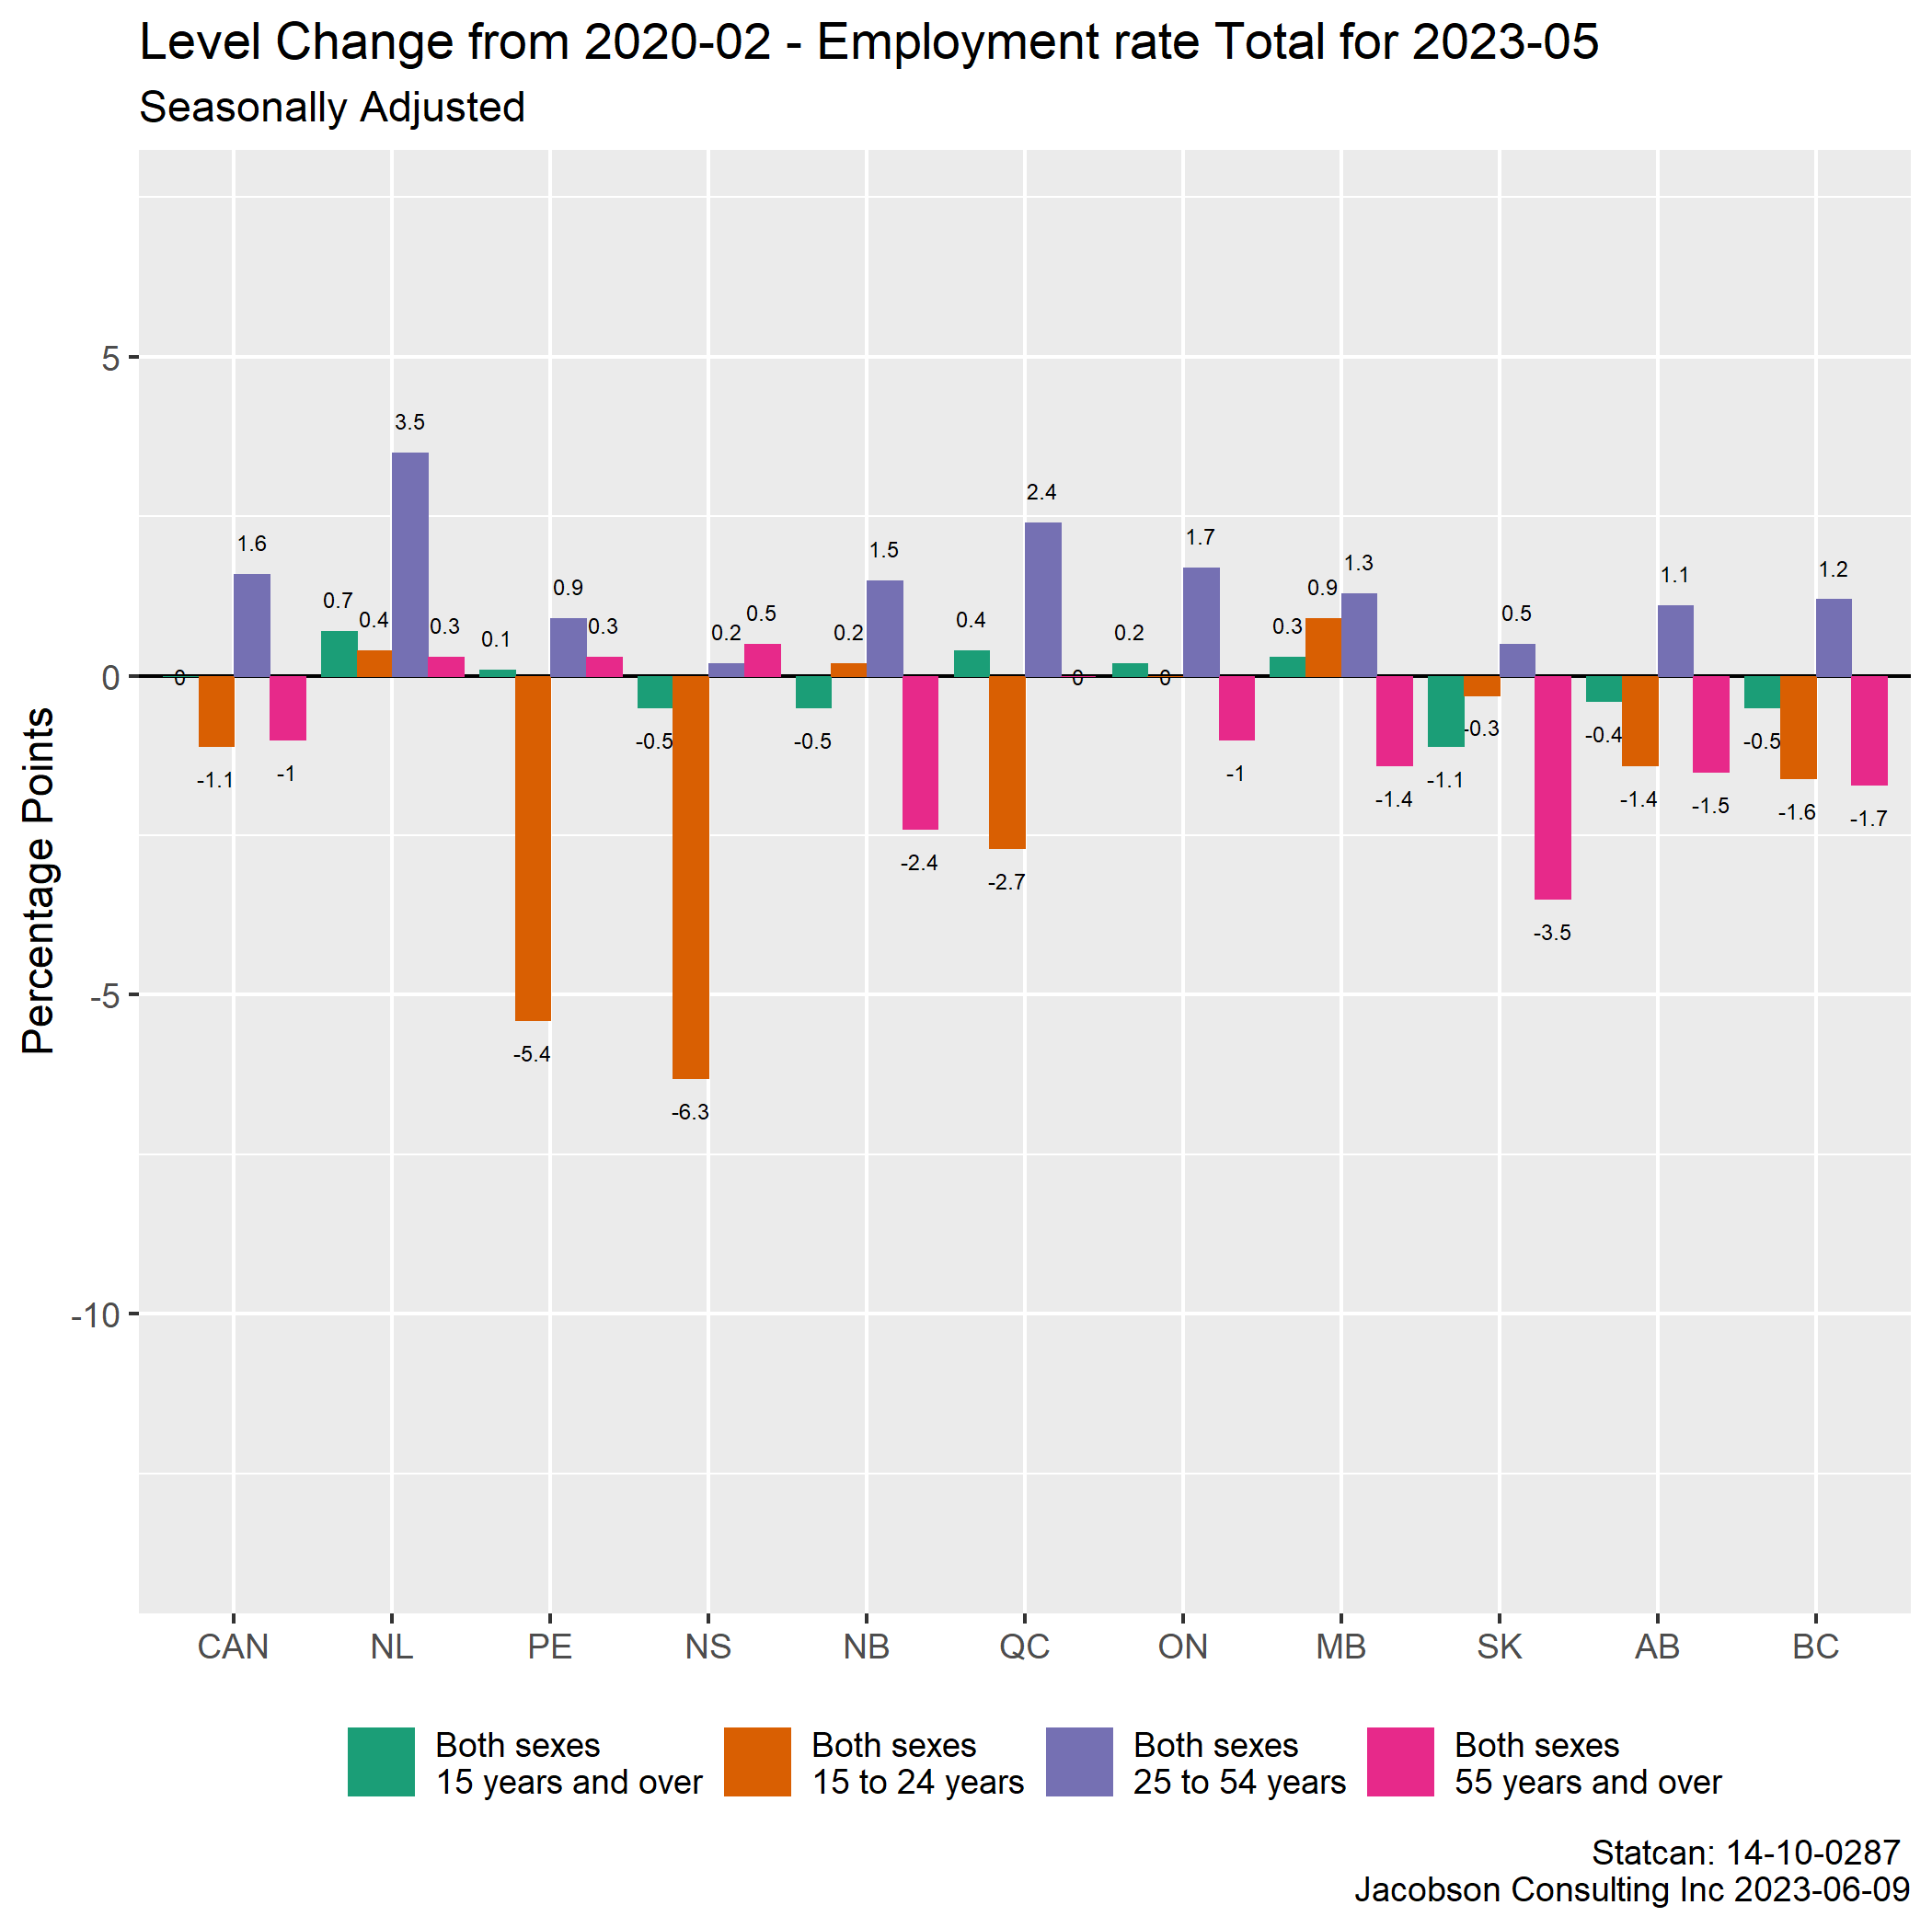
The employment rate drops since 2020-02 have been particularly marked for younger males in resource sensitive provinces such as QC (p34).
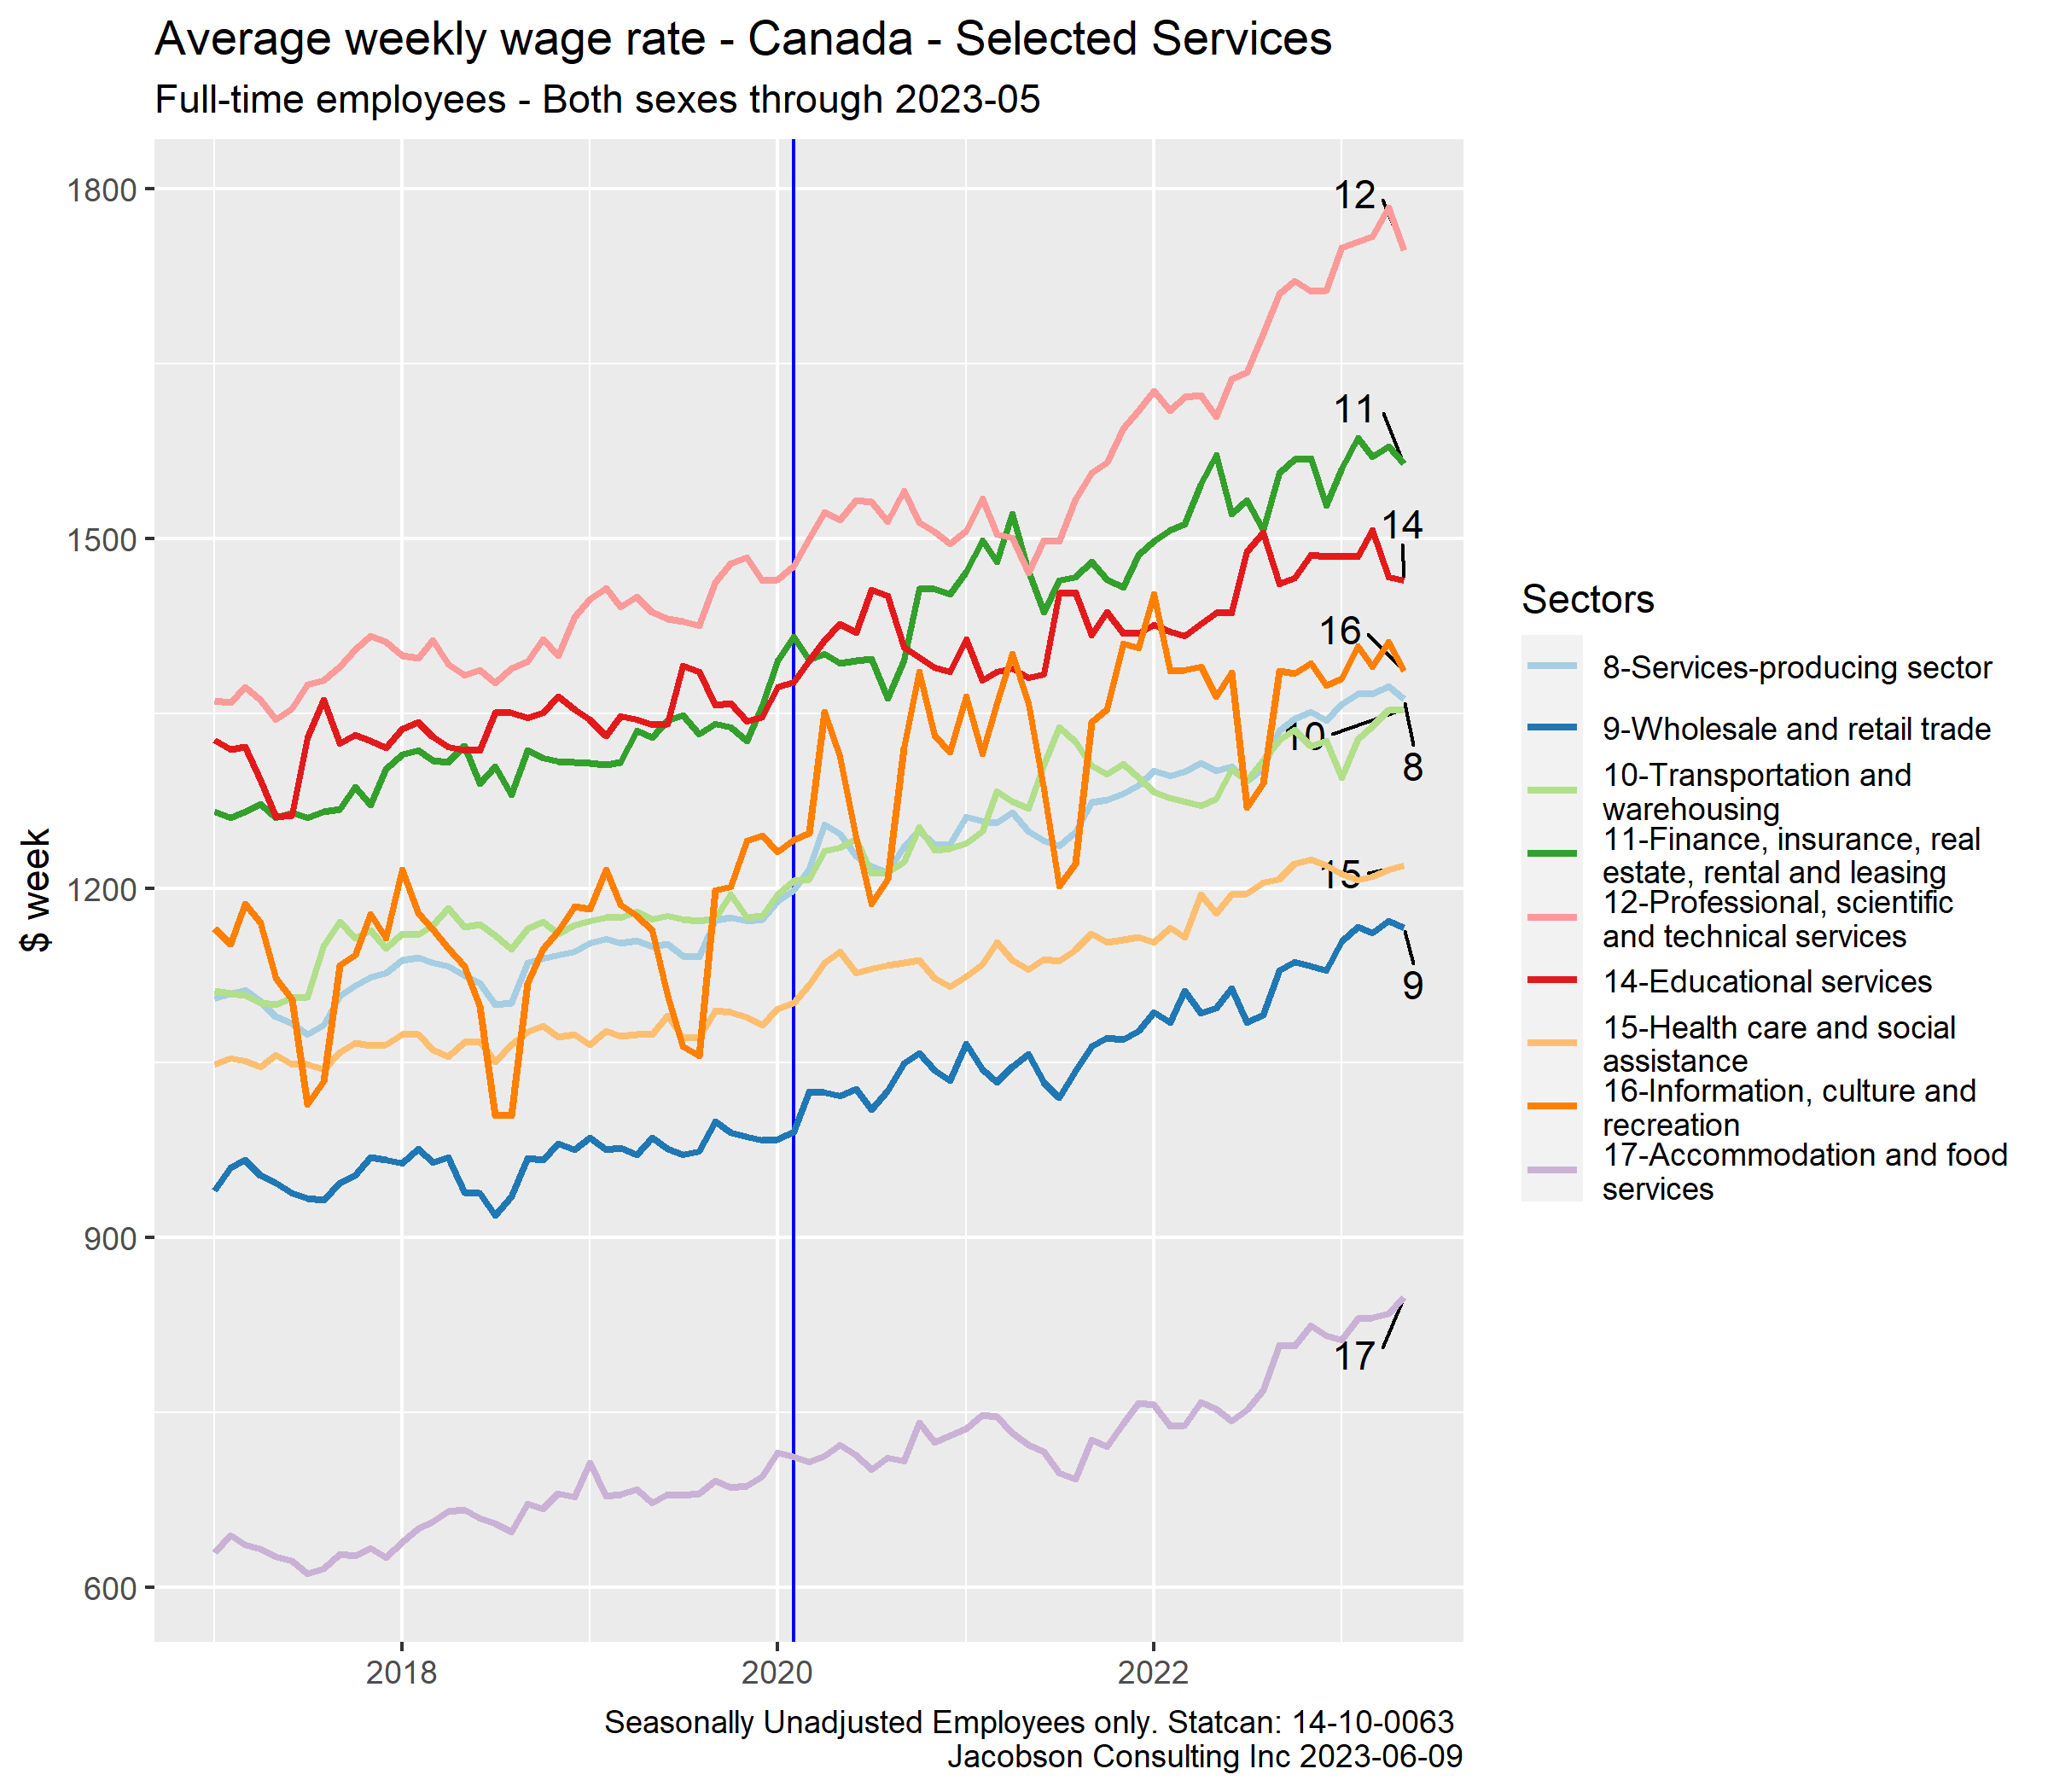
Wage gains are softening. In the next chart, note the downshifts in full-time wages in the Finance and Professional services sectors.
Wage analysis (fixed-weight) , adjusted for compositional shifts in occupations can a more useful perspective on wage change (p43).
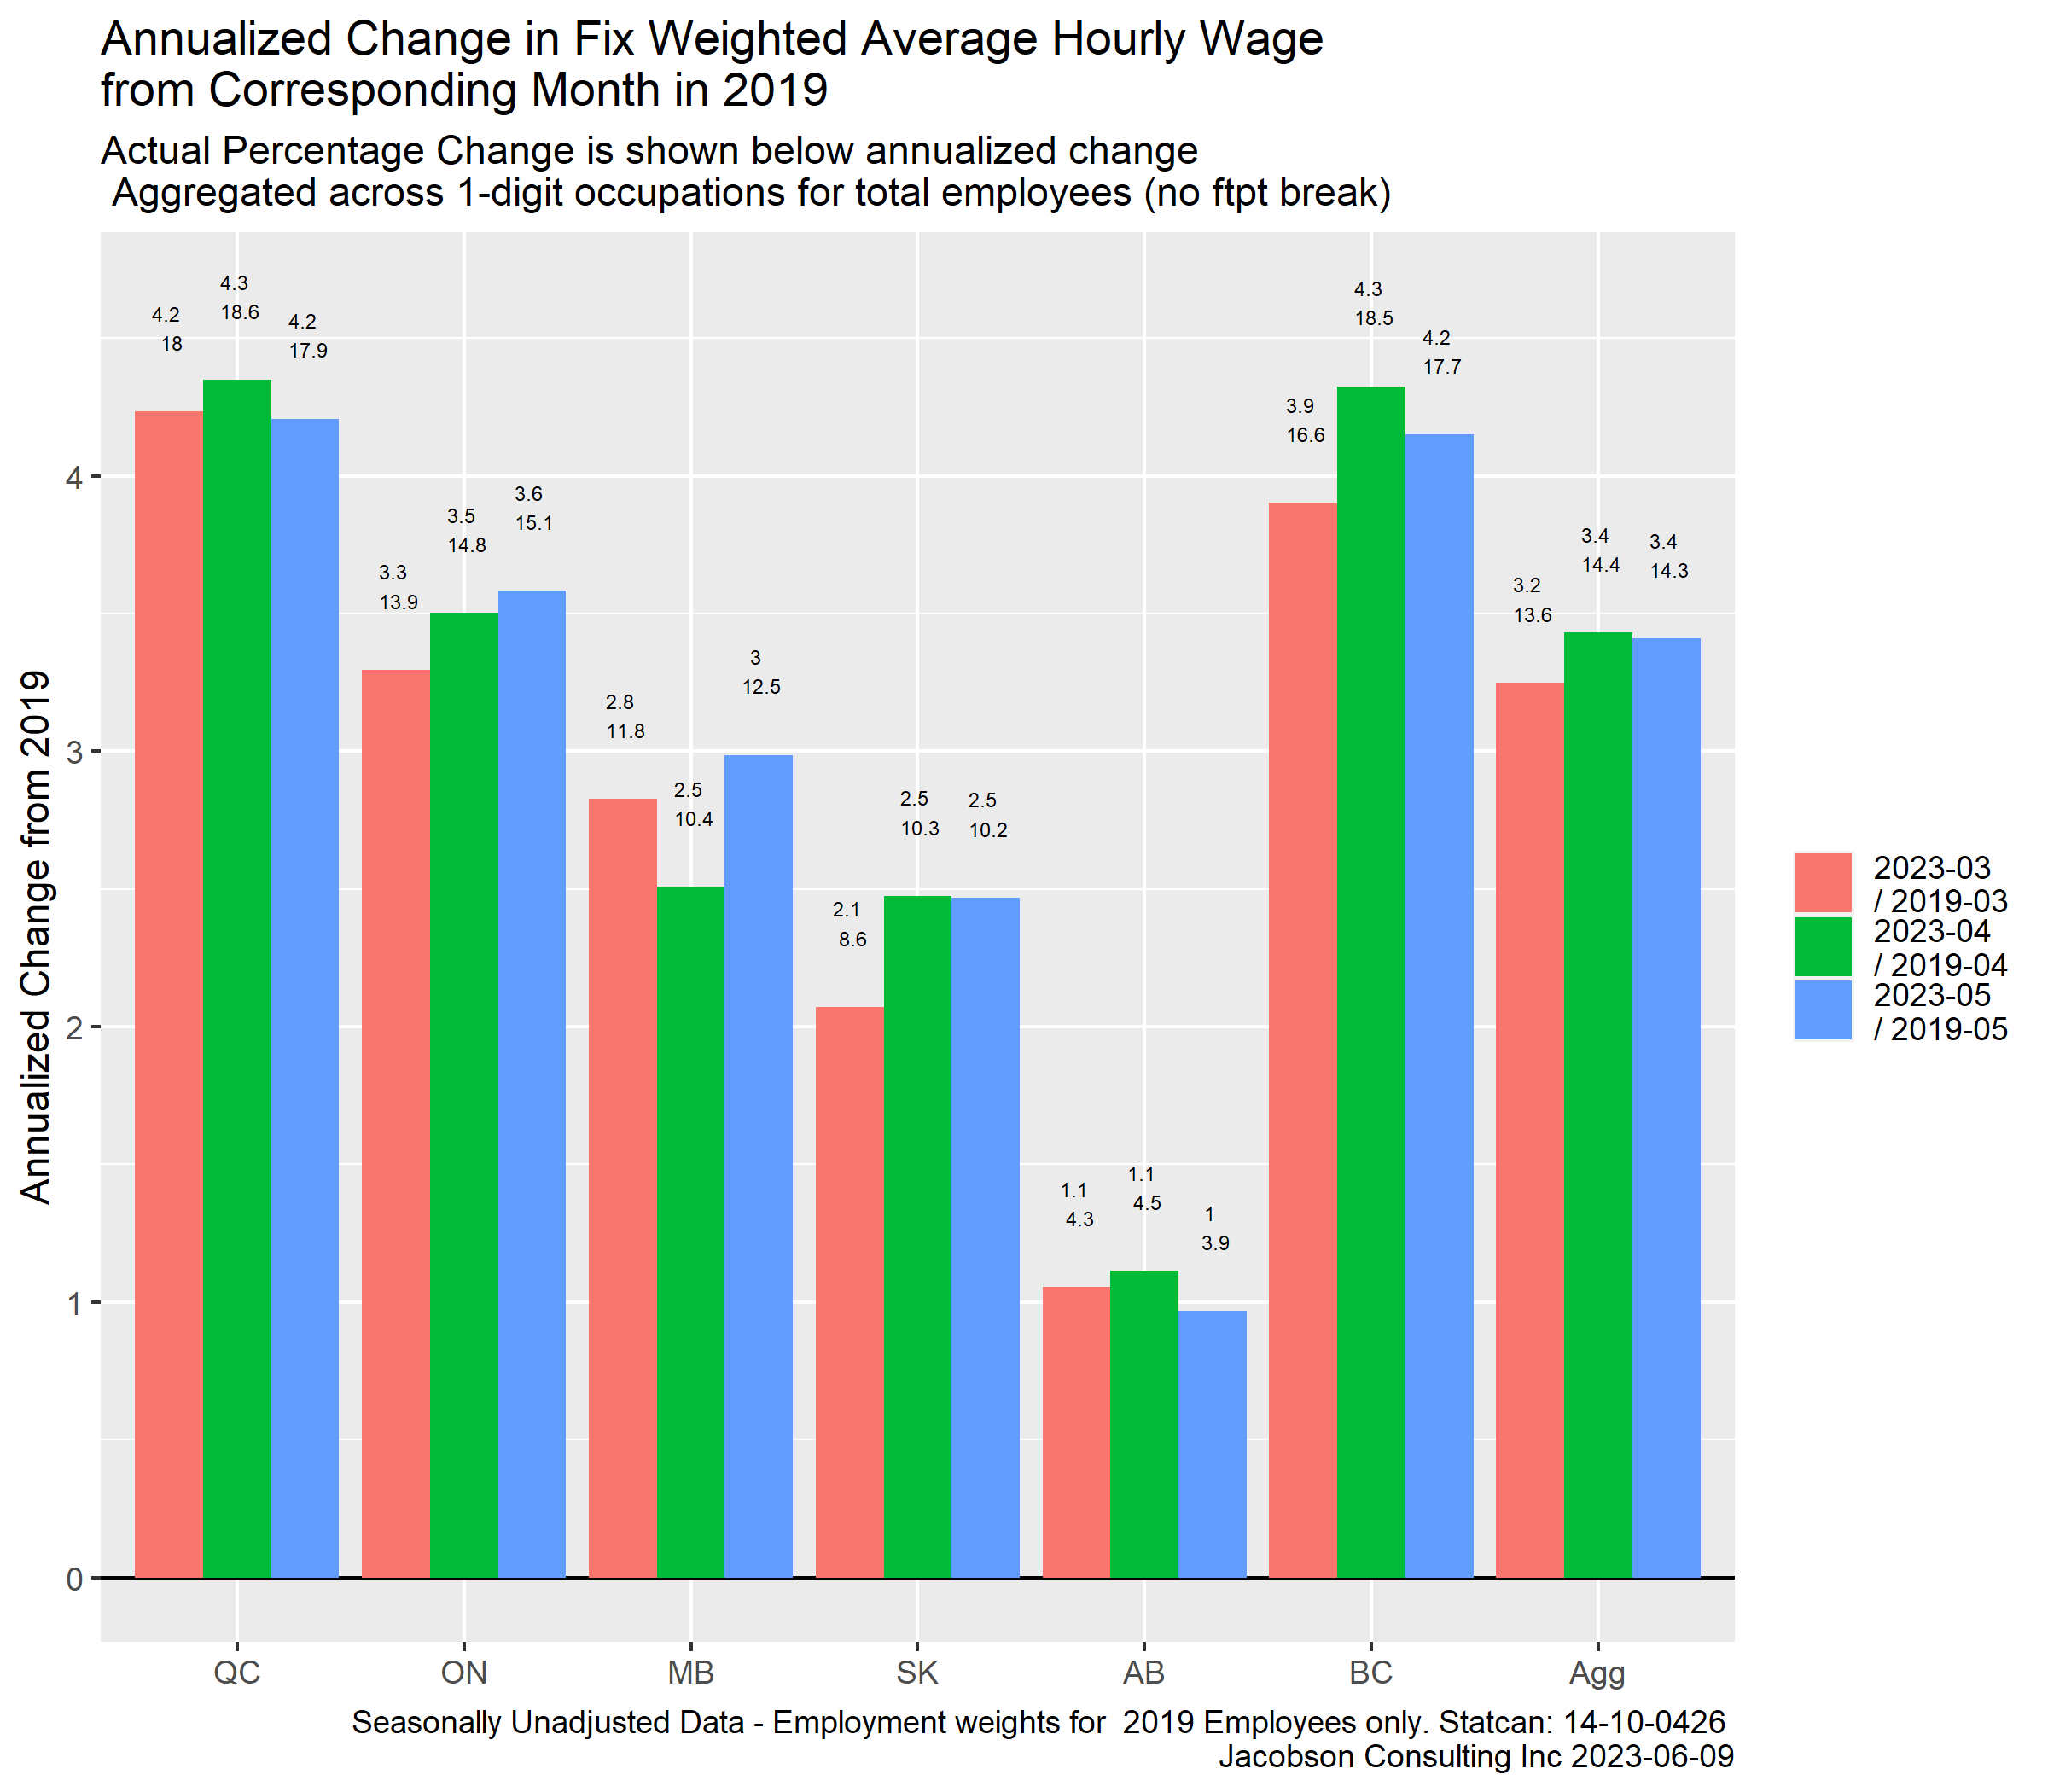
The AGG measure is for the provinces shown to stabilize for shifts in provincial activity. Not all provinces can be included in the aggregate because of confidentiality at the occupational level used for the fixed-weight measure. The message is that wages are not accelerating when viewed in this consistent fashion. Comparison to
Compared (seasonally unadjusted) to the previous year and to 2020-02, employment gains for females in the higher wage categories have been slightly better than for males.
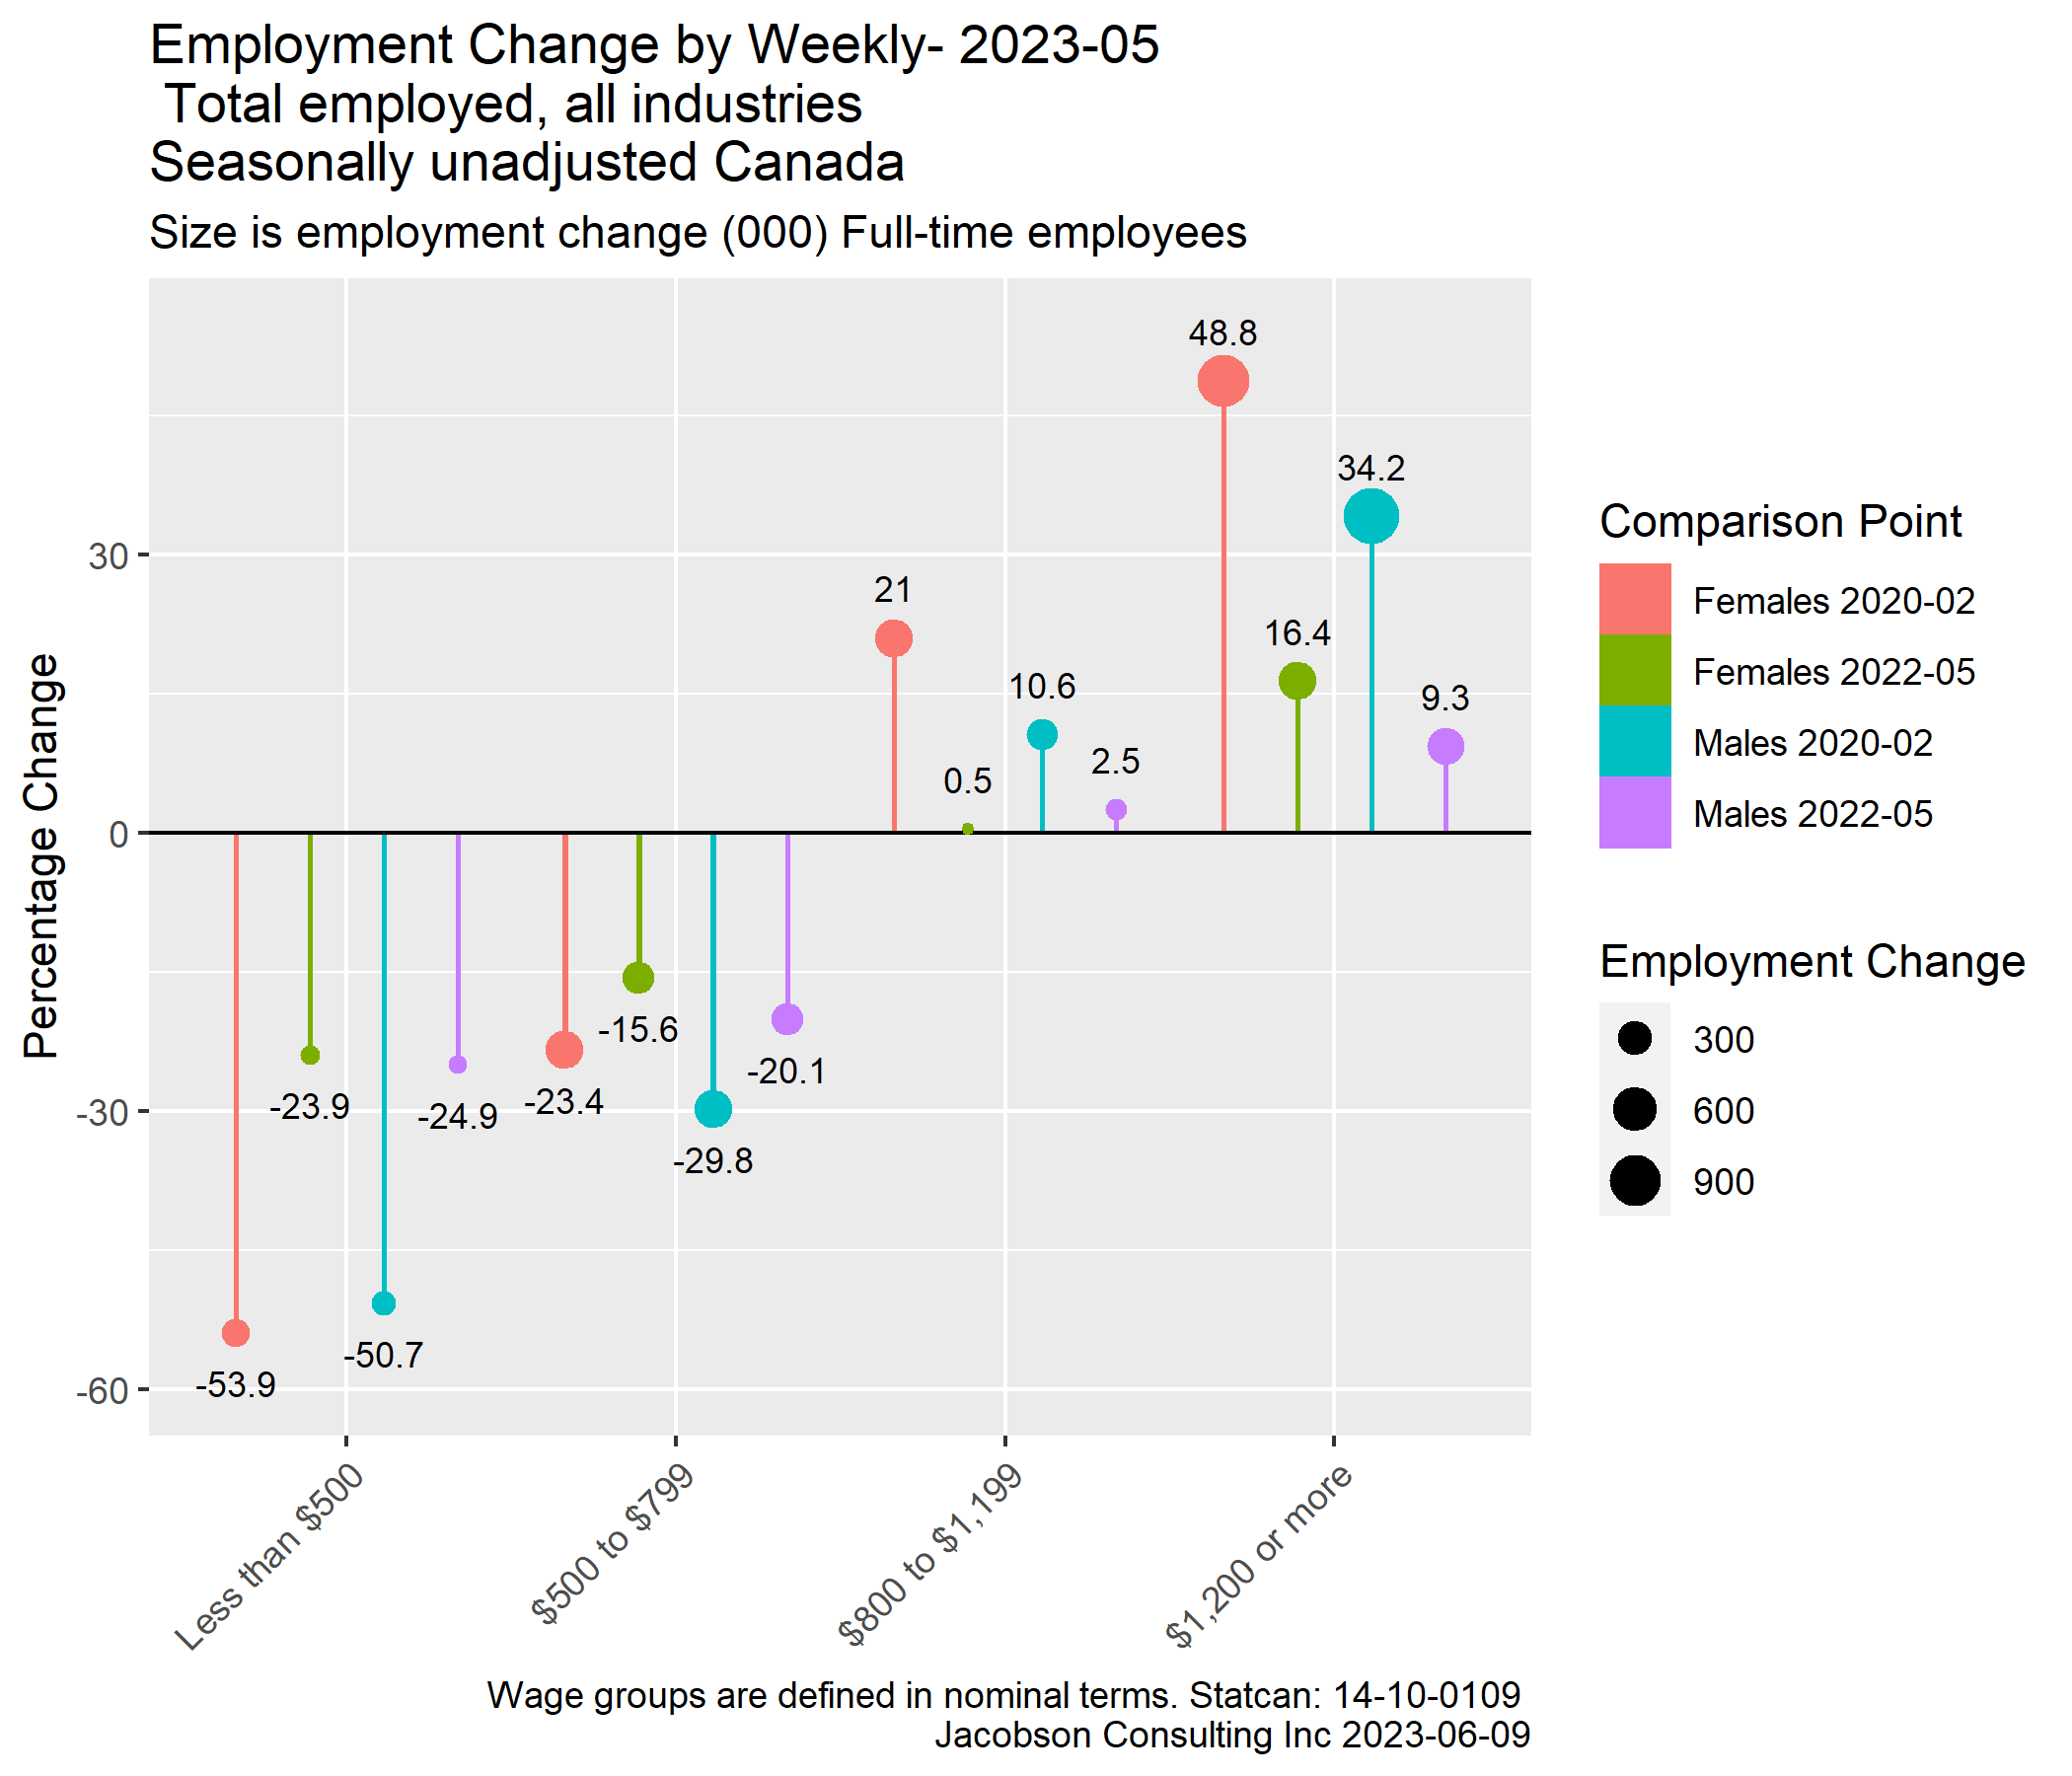
Equivalent data for part-time workers (p55) shows stronger gains for males.
Male dominance in the higher wage groups has only slightly declined over time.

https://www.jacobsonconsulting.com/jci_site/index.php/downloads-2/labour-force-charts-data-ending-2023-05/viewdocument/468