
CPI through 2026-04
Supply effects including gas prices and taxes dominate

Headlines
A war of US choice has created a firestorm of supply effects including gas prices. Our CPI is dominated by supply issues, particularly the goods sector. As supply chains fracture, unravelling may be a story.
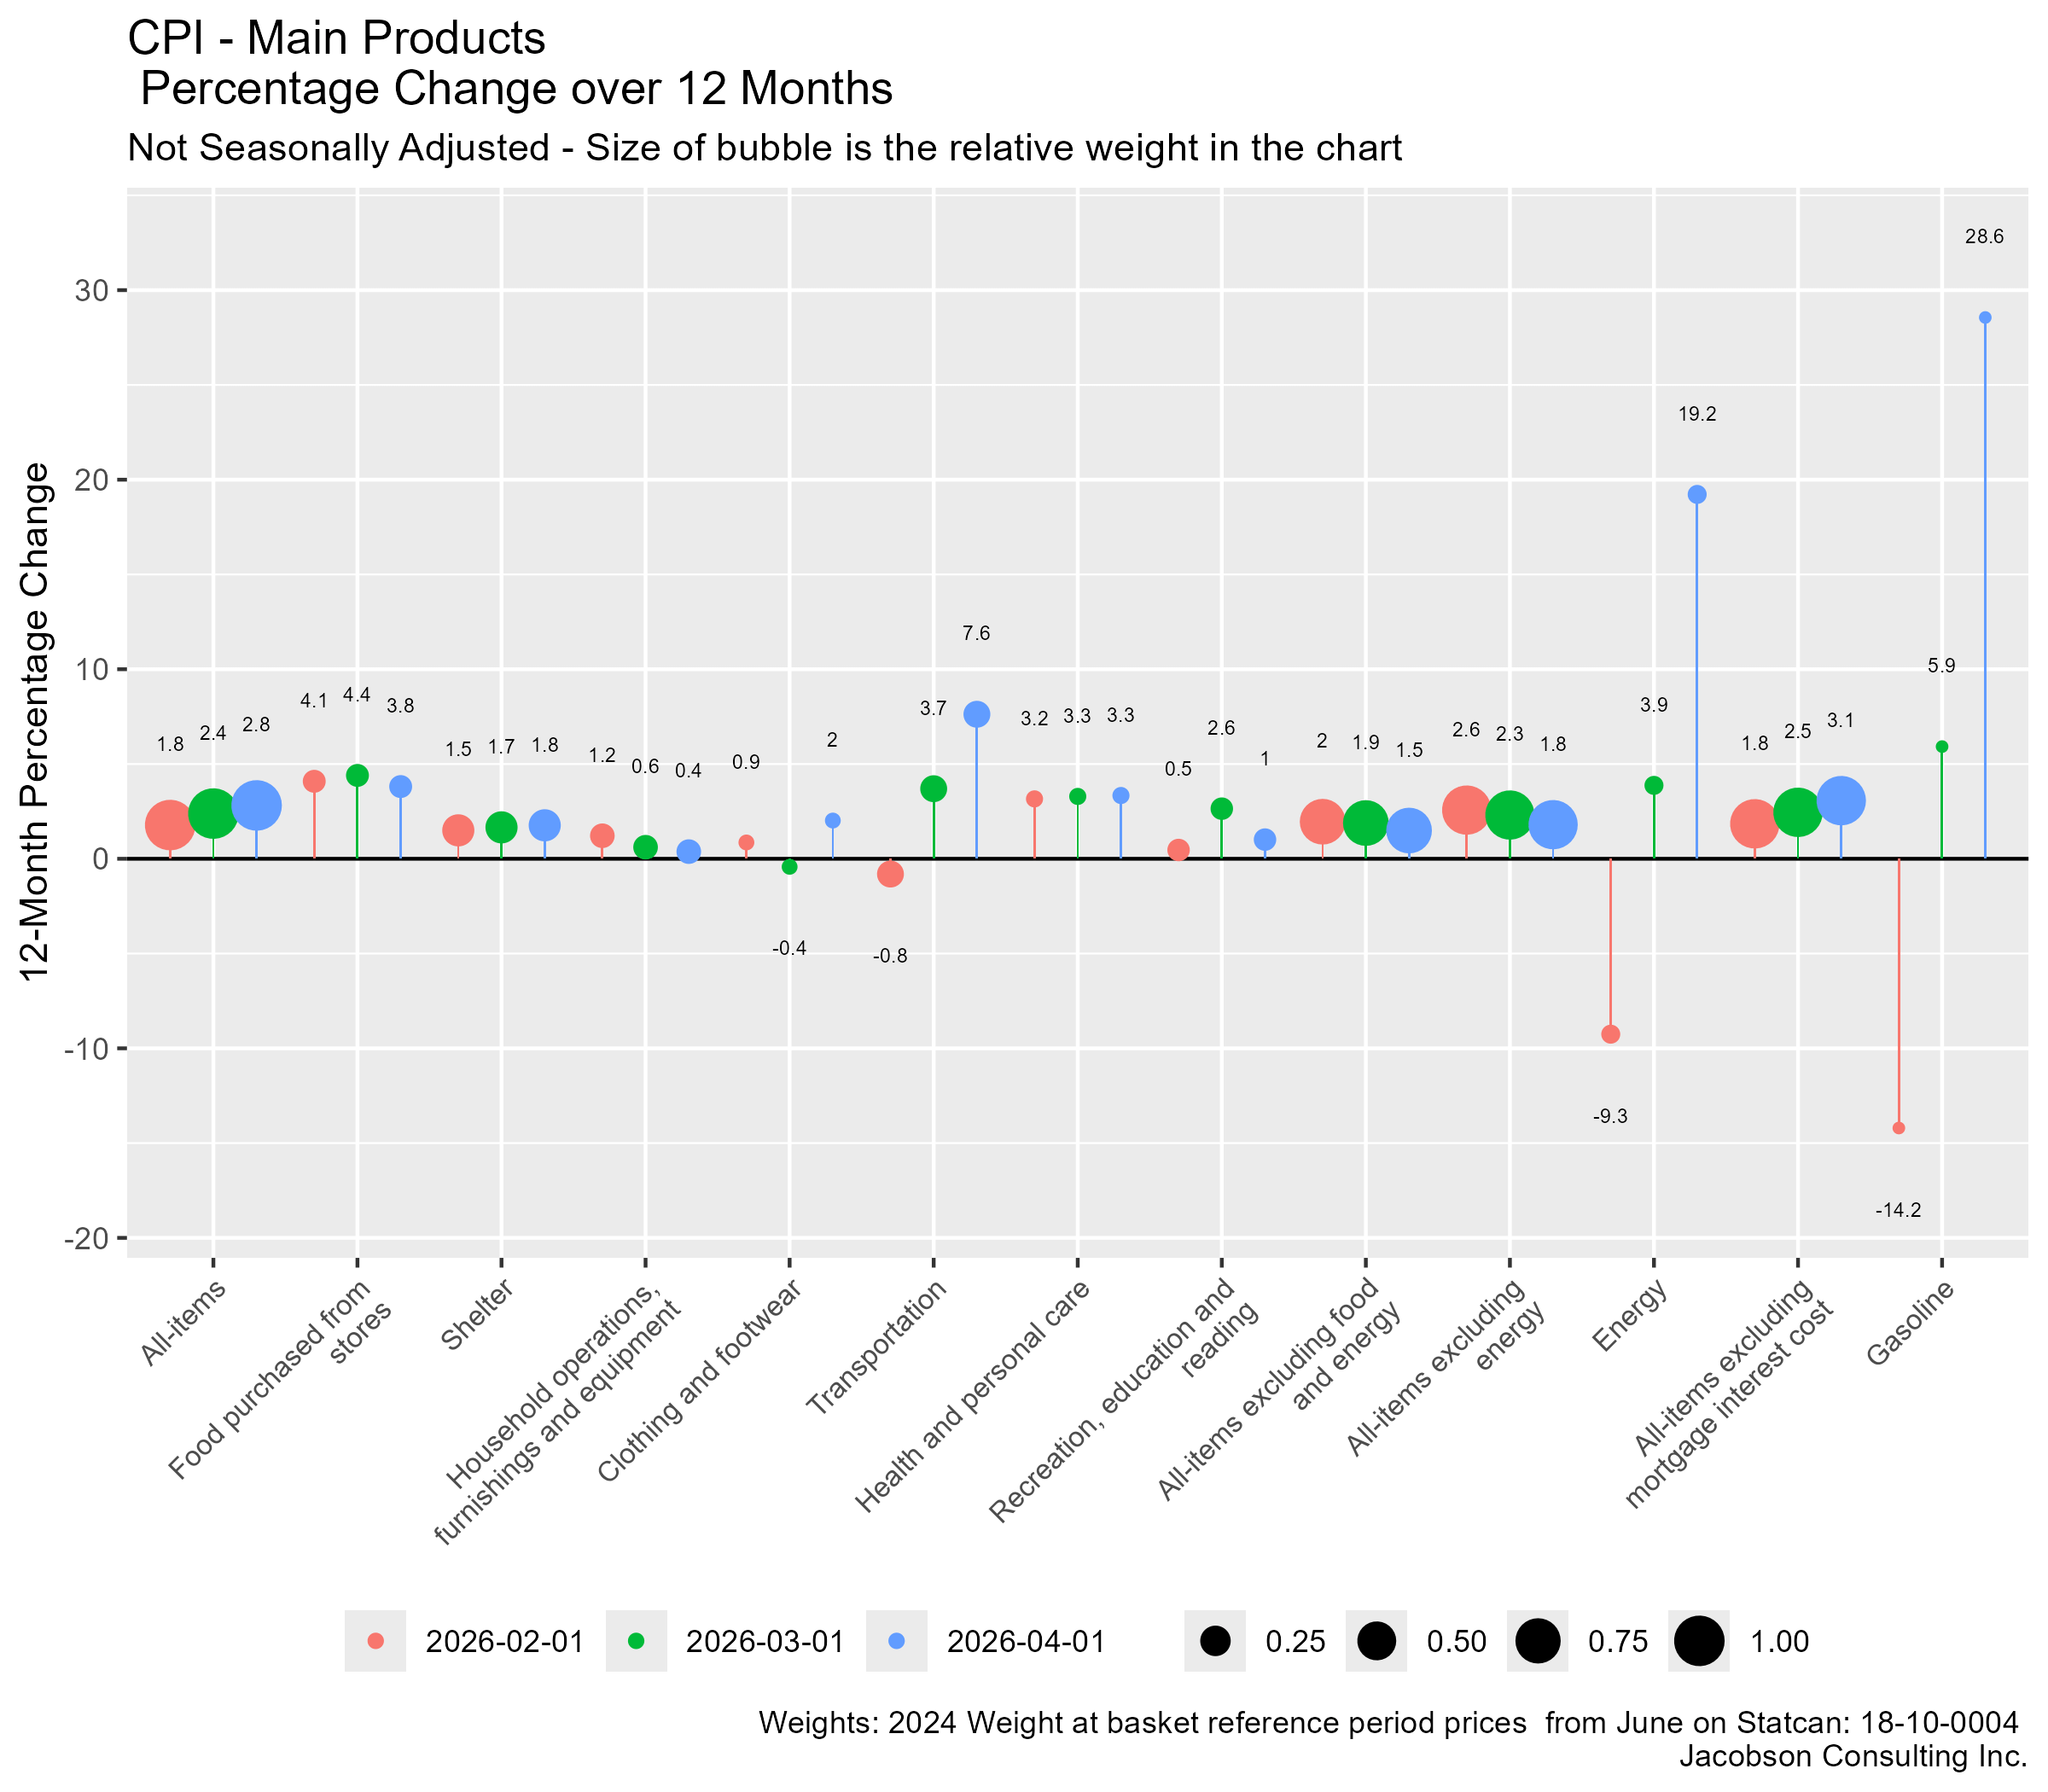
Transportation costs and energy (world prices) are the big movers. However, the transportation costs associated with goods are not that large but may be used to expand margins. The first chart is the traditional 12 month perspective.
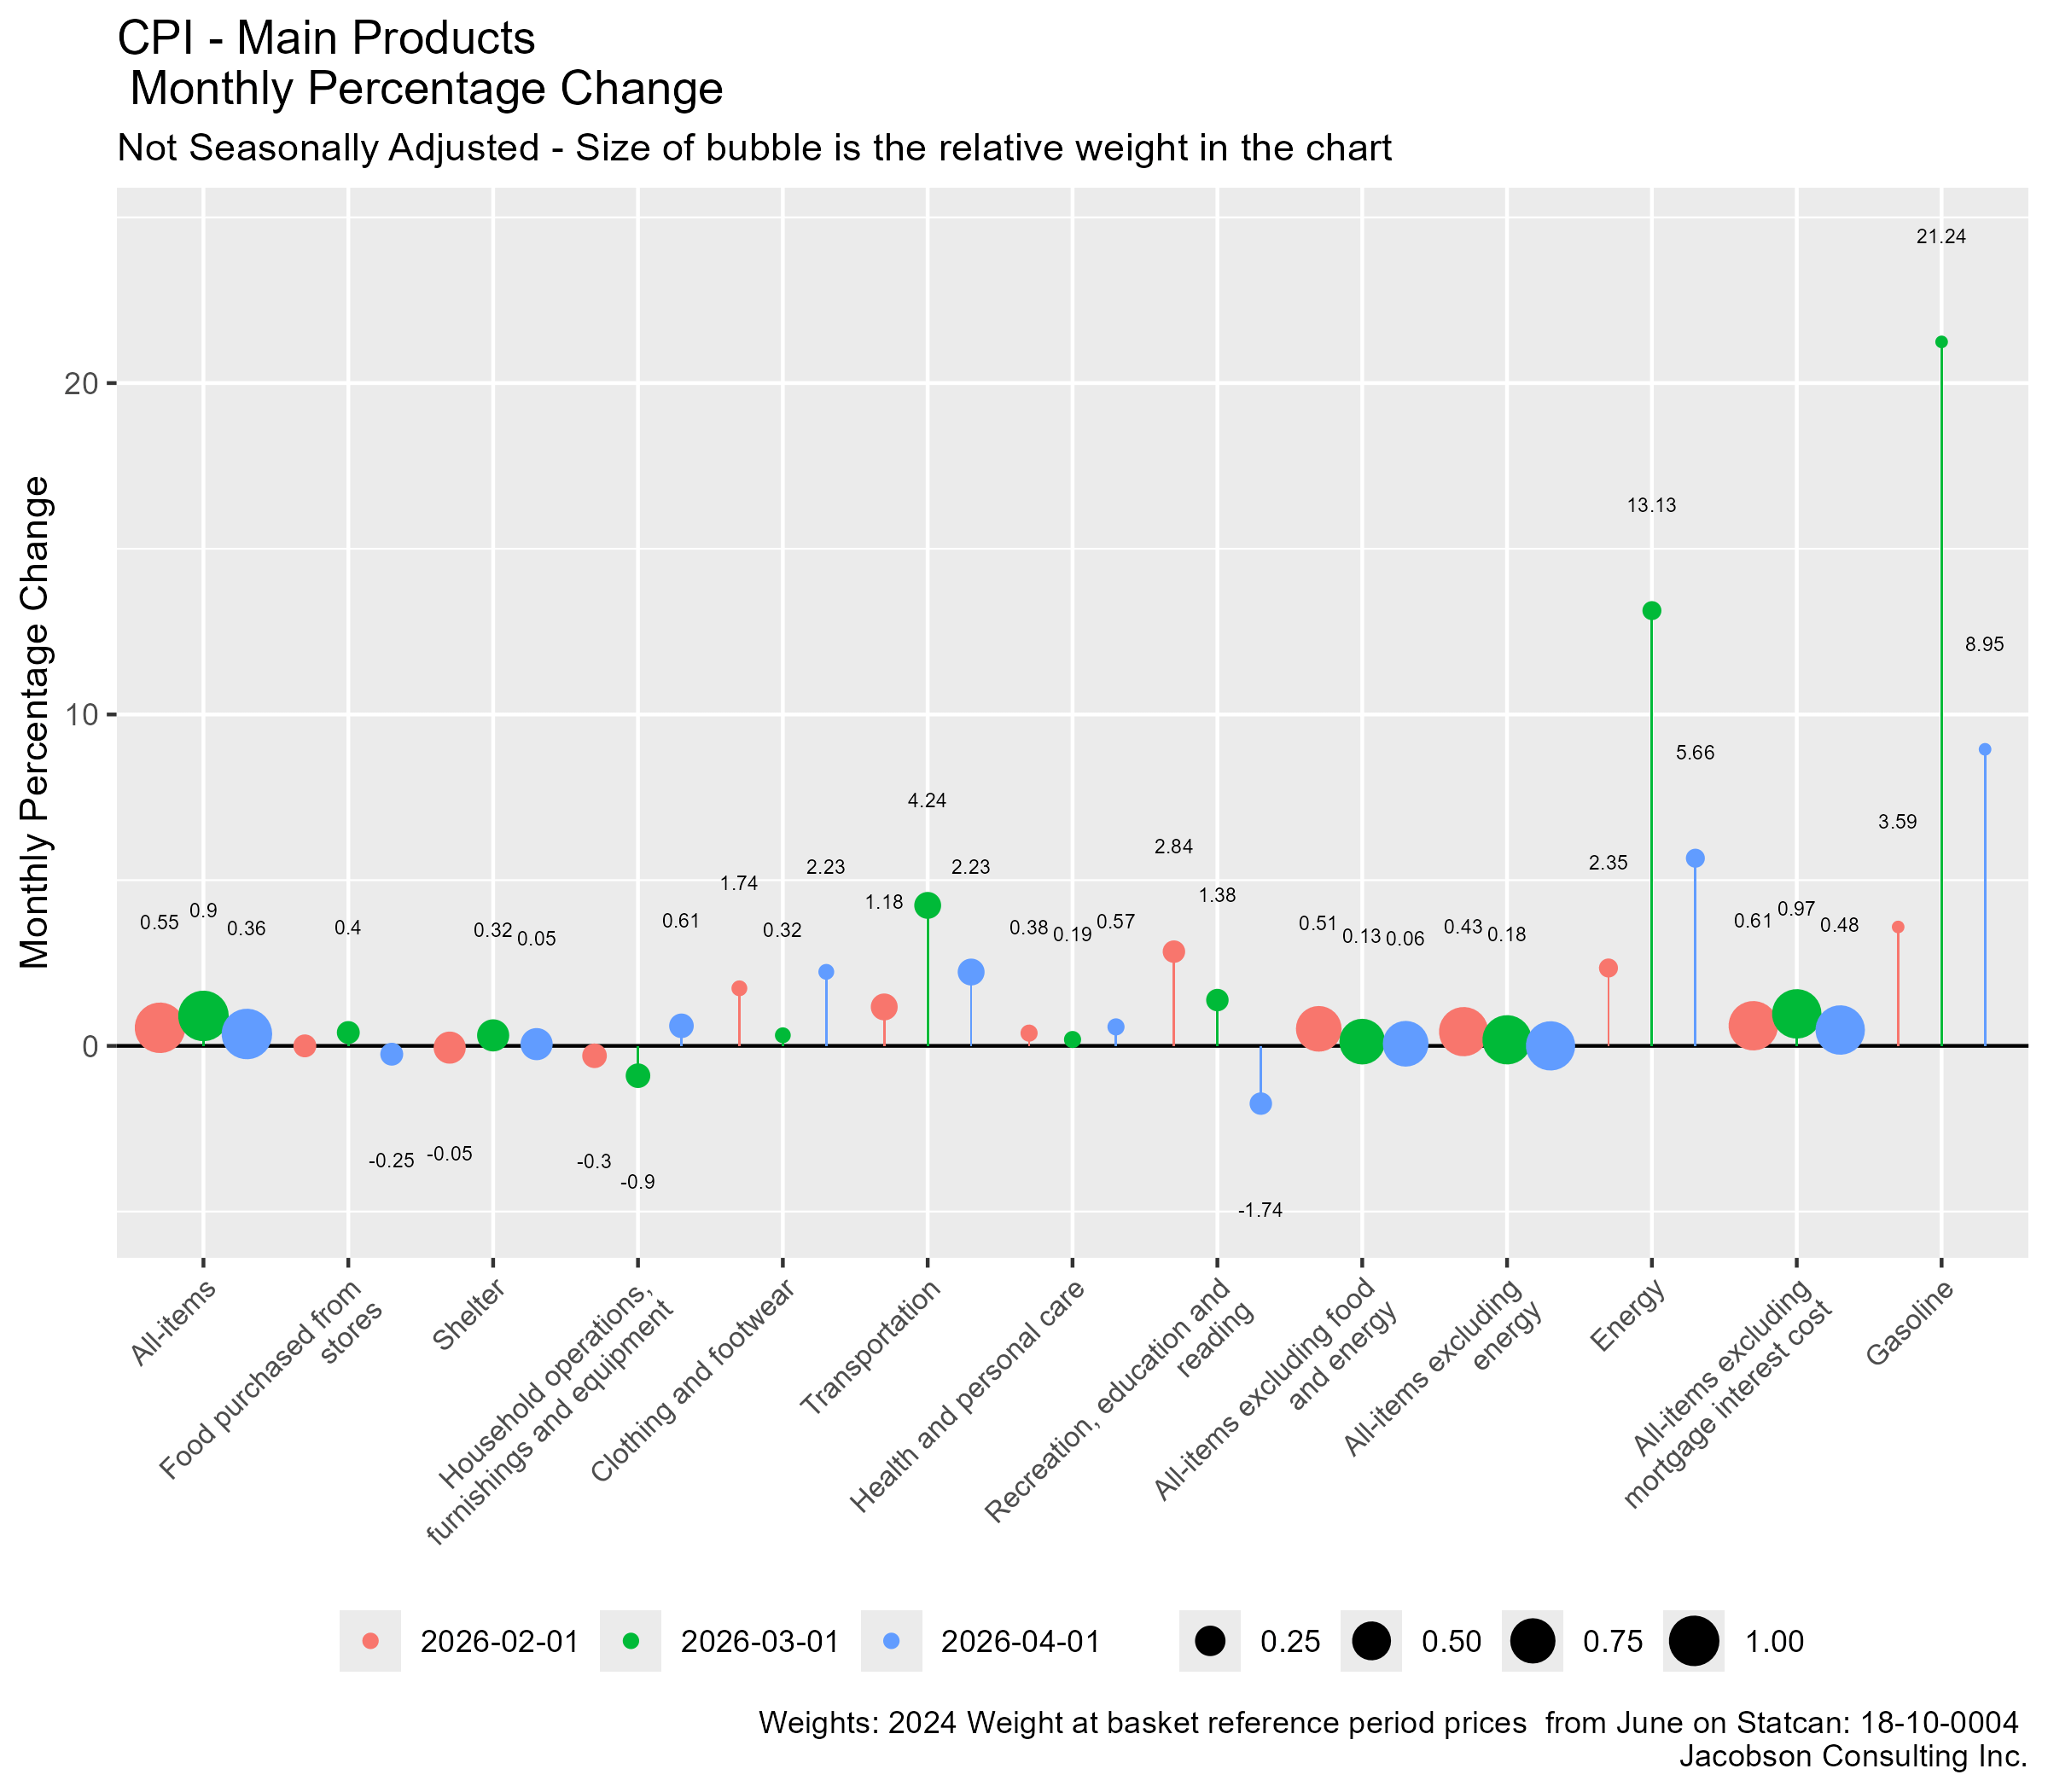
Starting points matter. The monthly chart shows that the big shifts happened in March due to energy. Excluding that, the rate of price change is declining.
The Daily correctly notes the slowdown in rental price change.
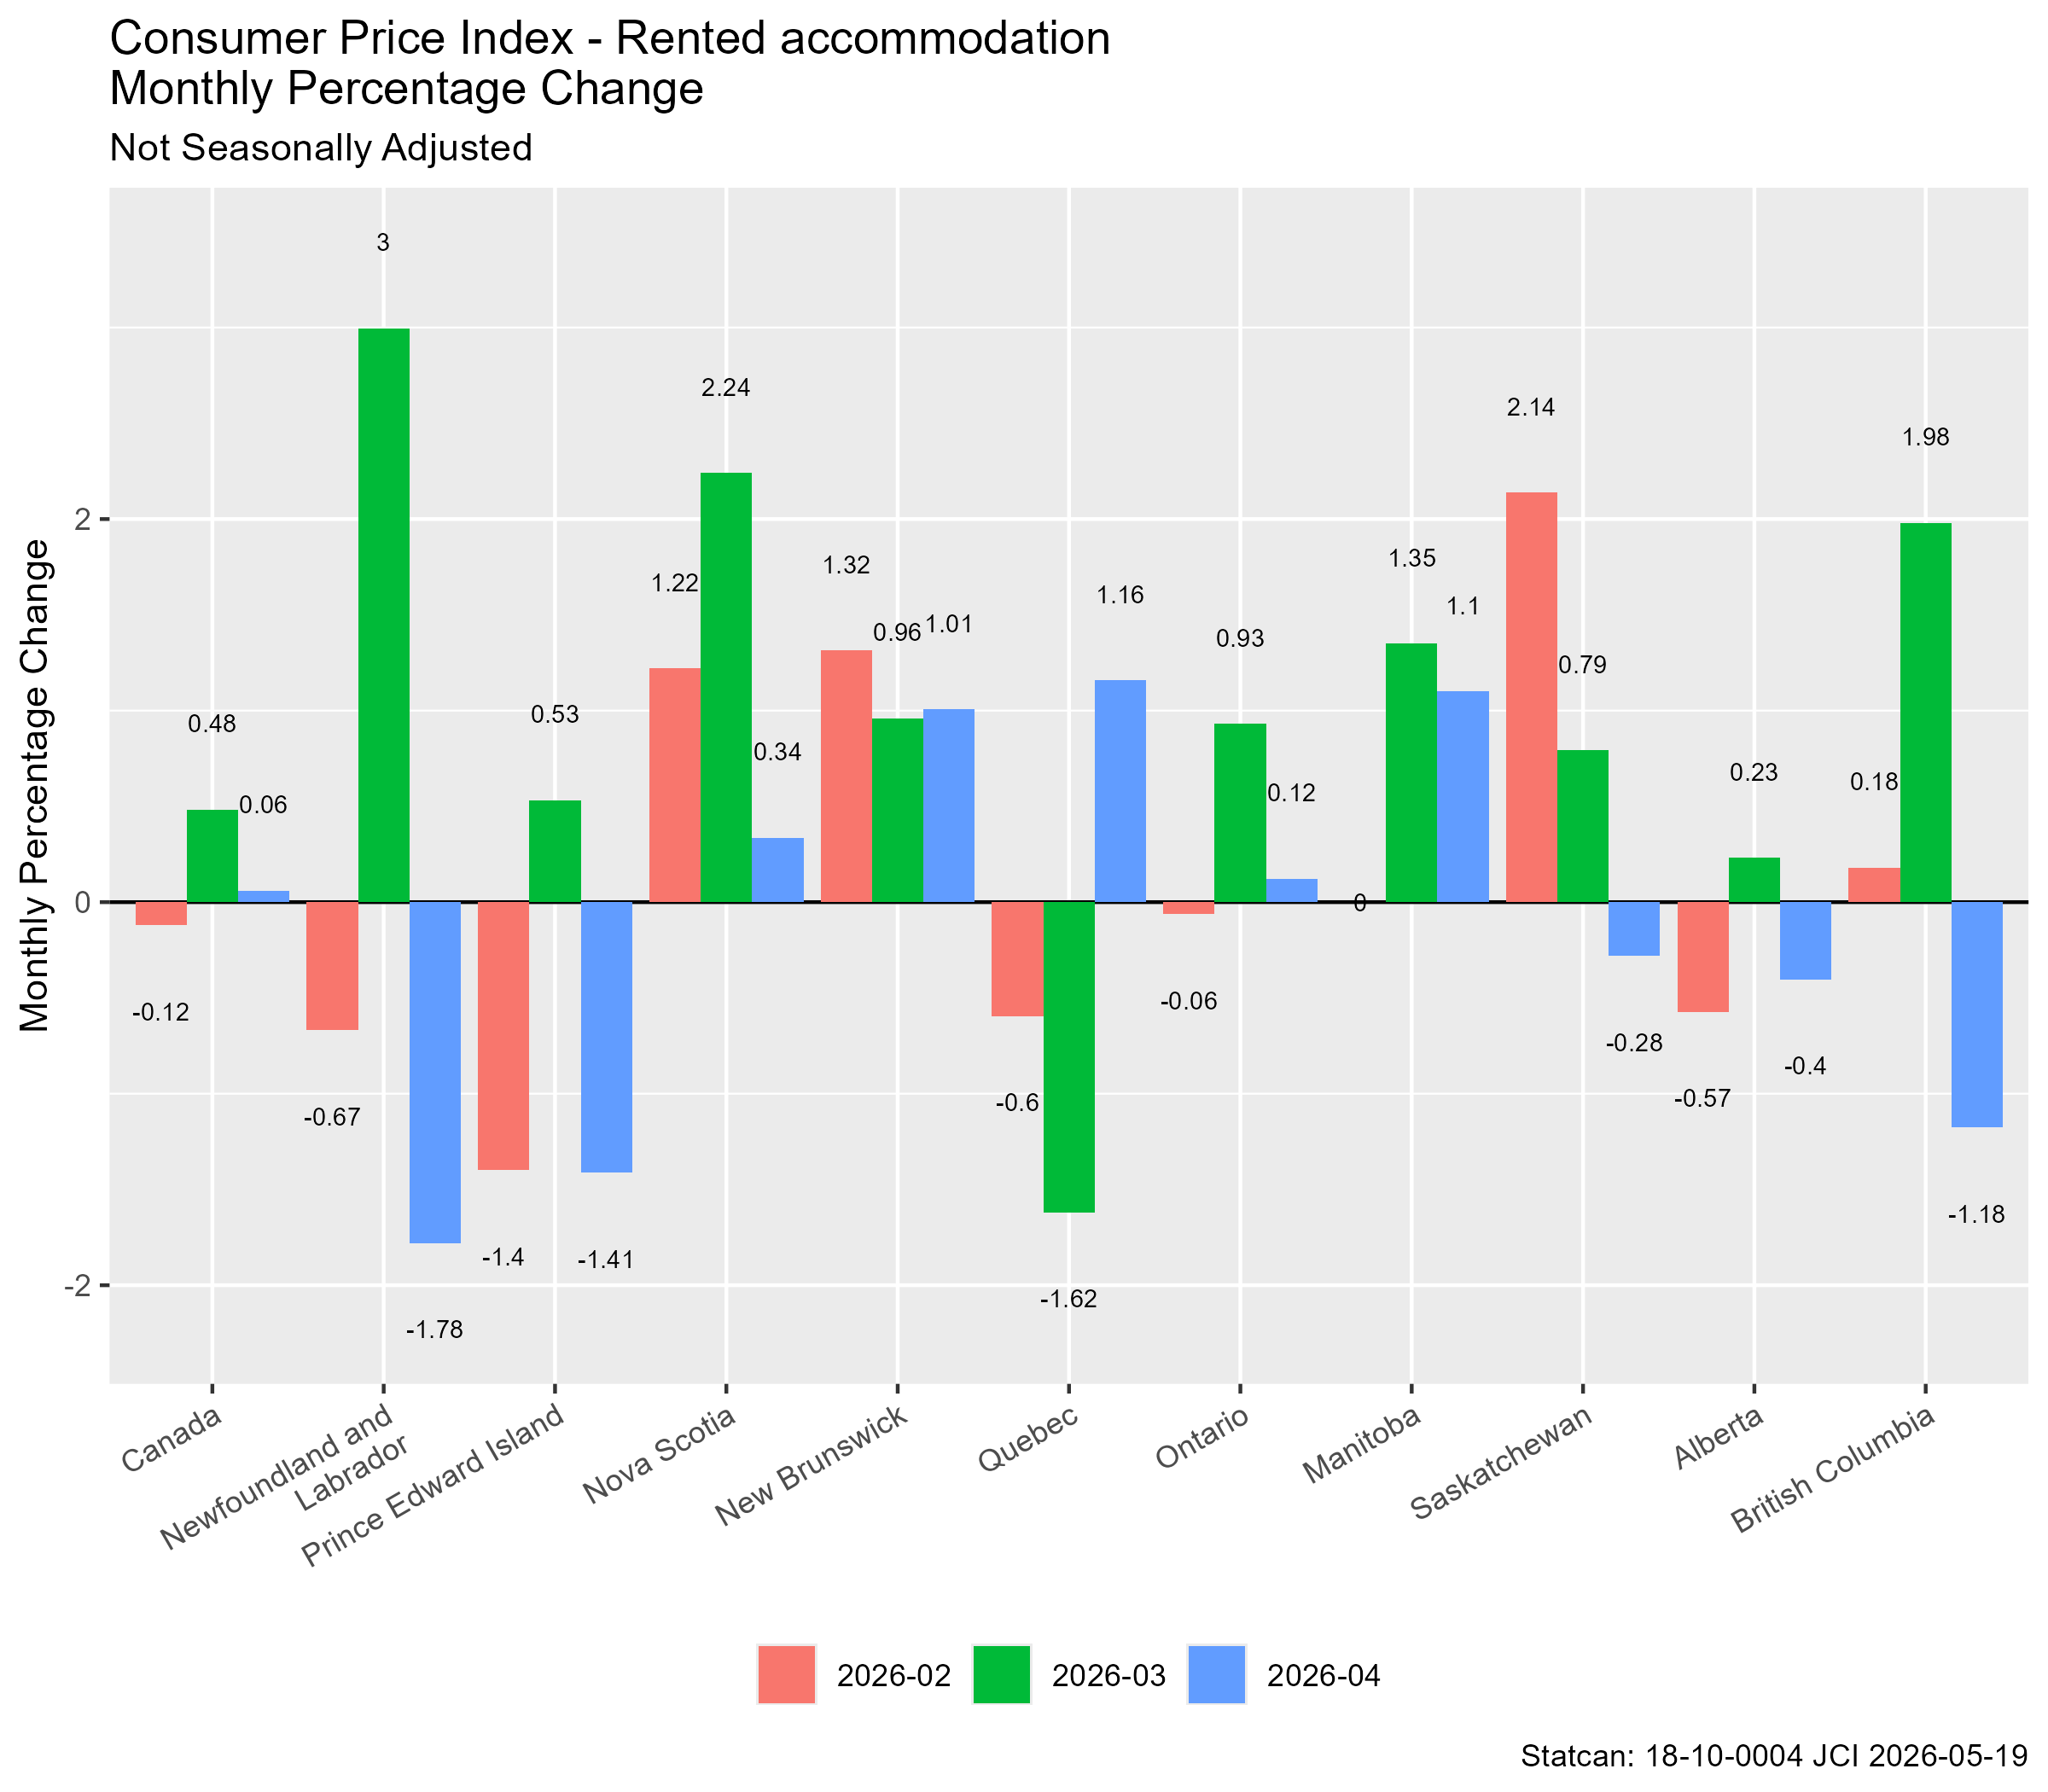
Rents are one of the important spatial measures. Local rents affect consumer behaviour. Volatility is evident.
Food
Food at home is a major concern for most of us. The next chart shows the monthly change on food prices It is good that we are at the time of greater domestic production. Hence the price declines. However, research by Statistics Canada indicates the importance of retailer margins in the grocery sector. Policy intervention may be needed to keep margins from needless expansion.
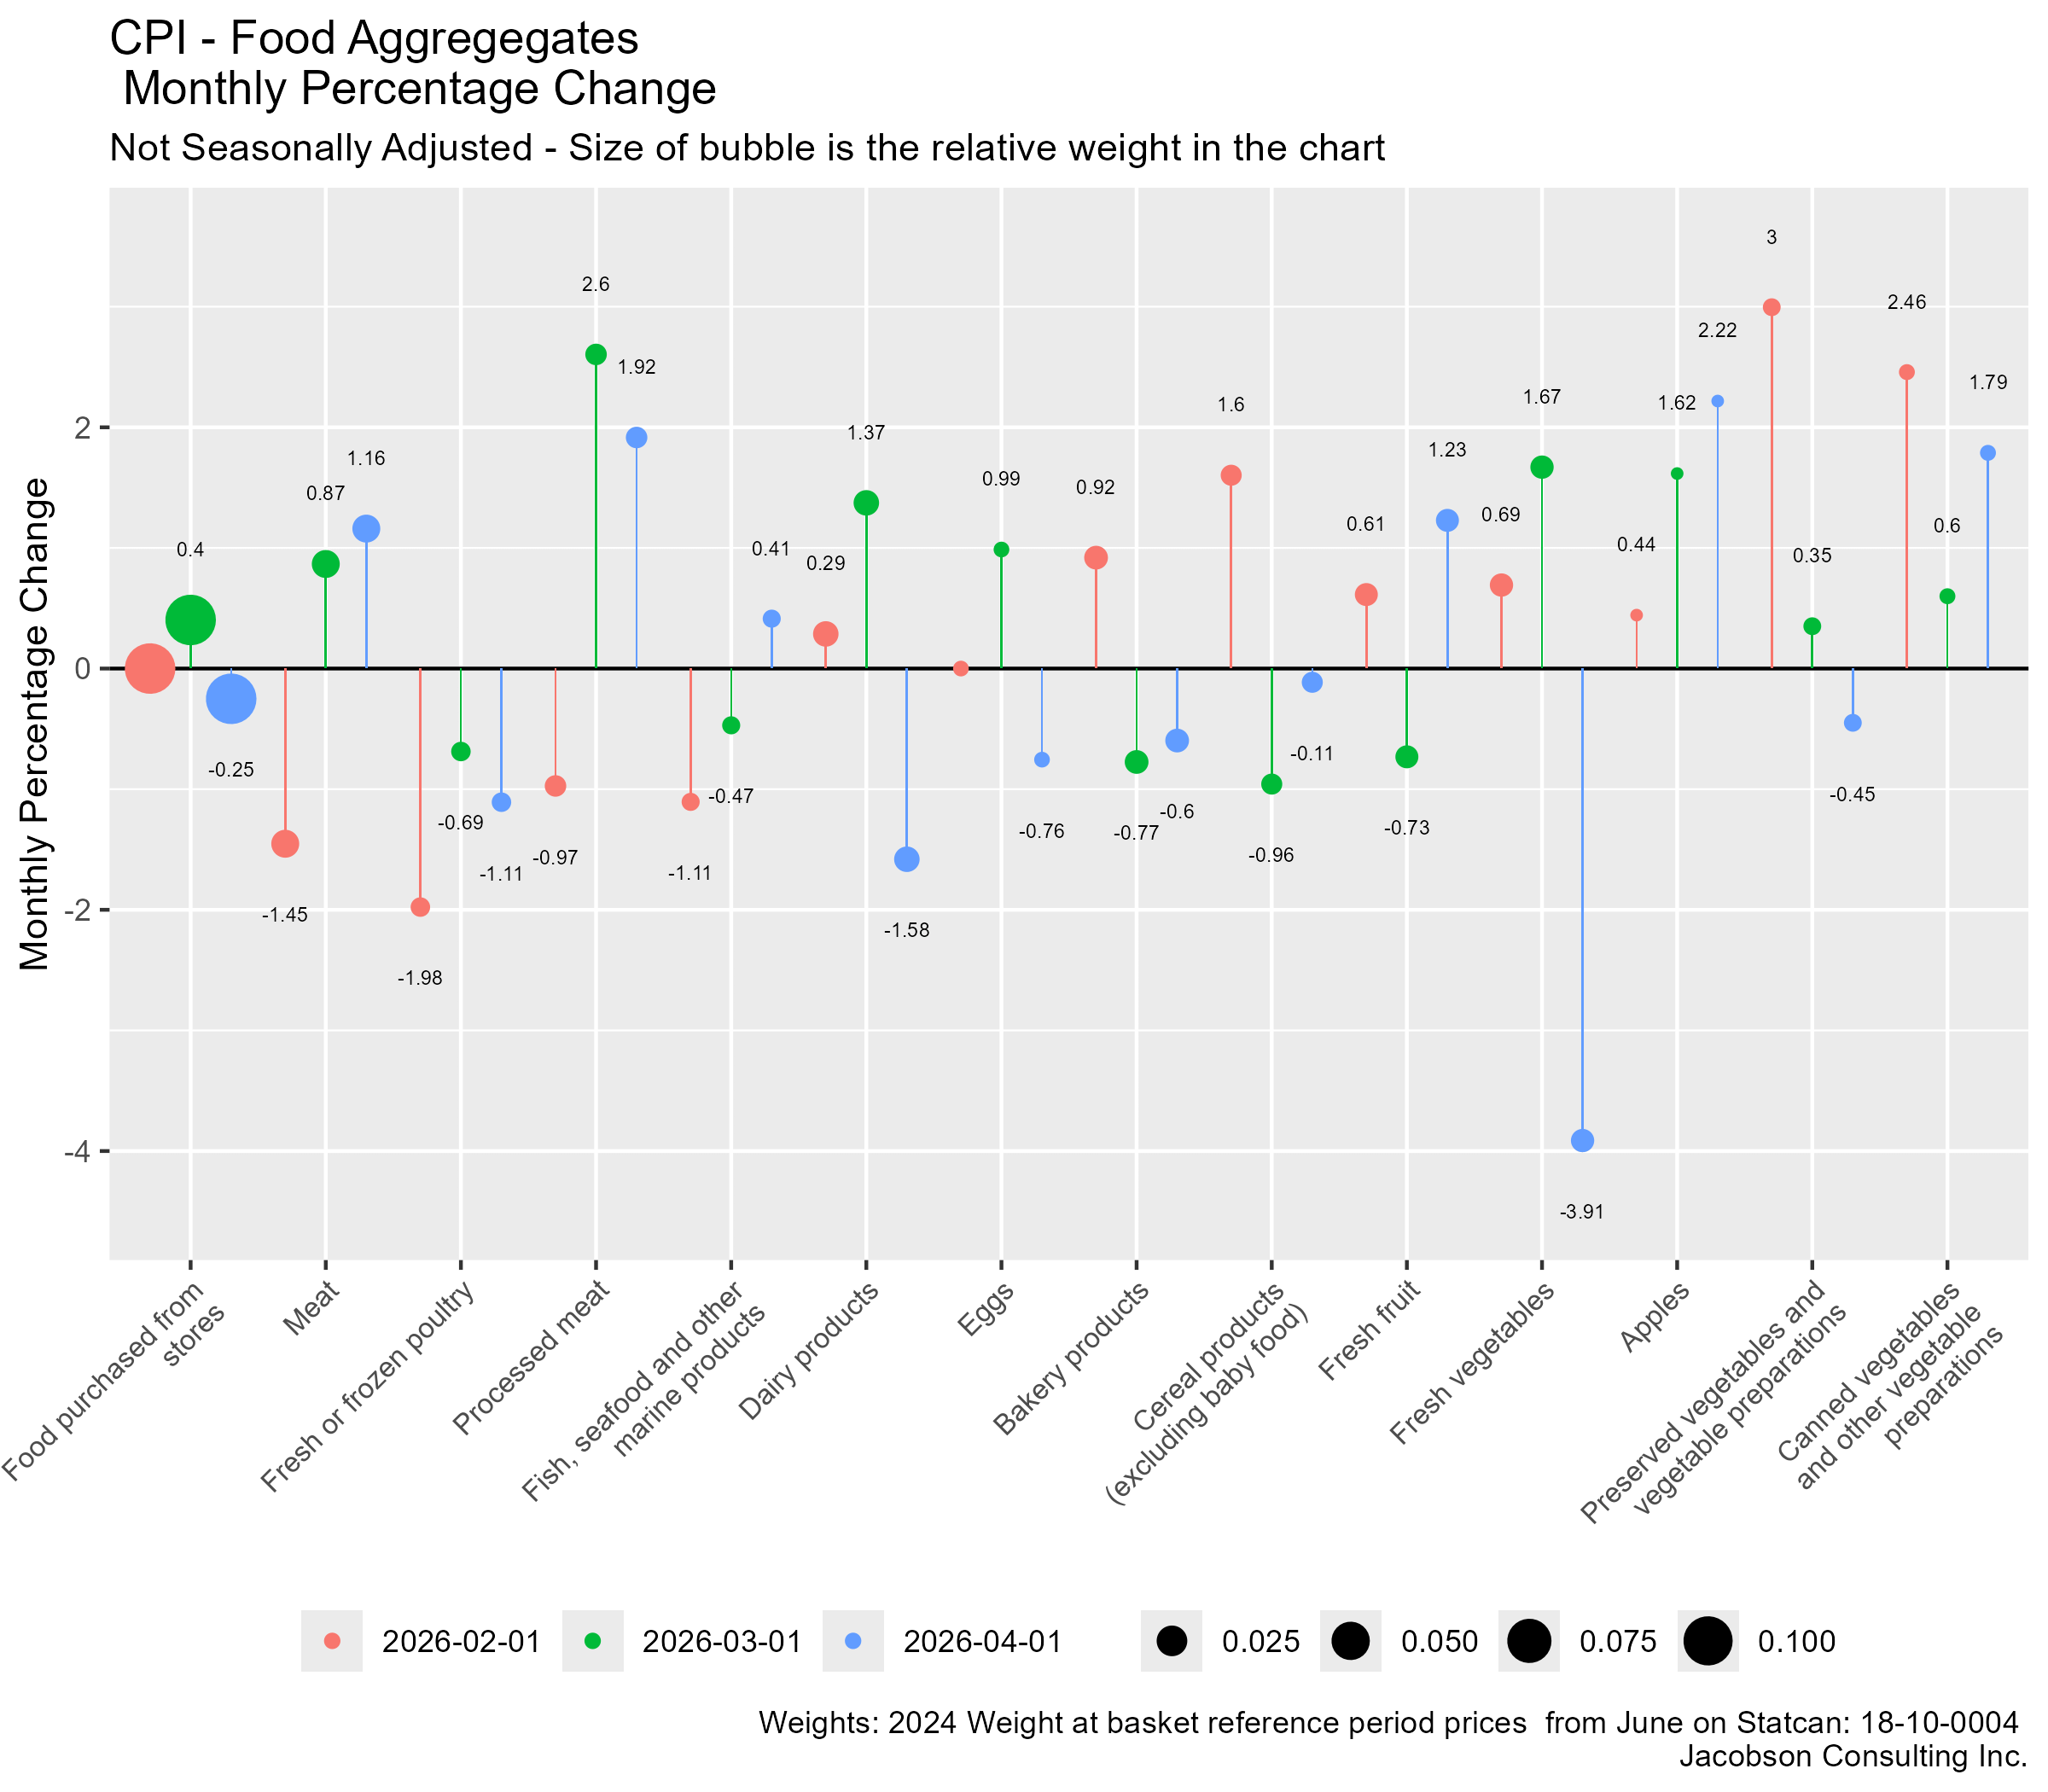
Regional prices indicate competitive issues across the country.
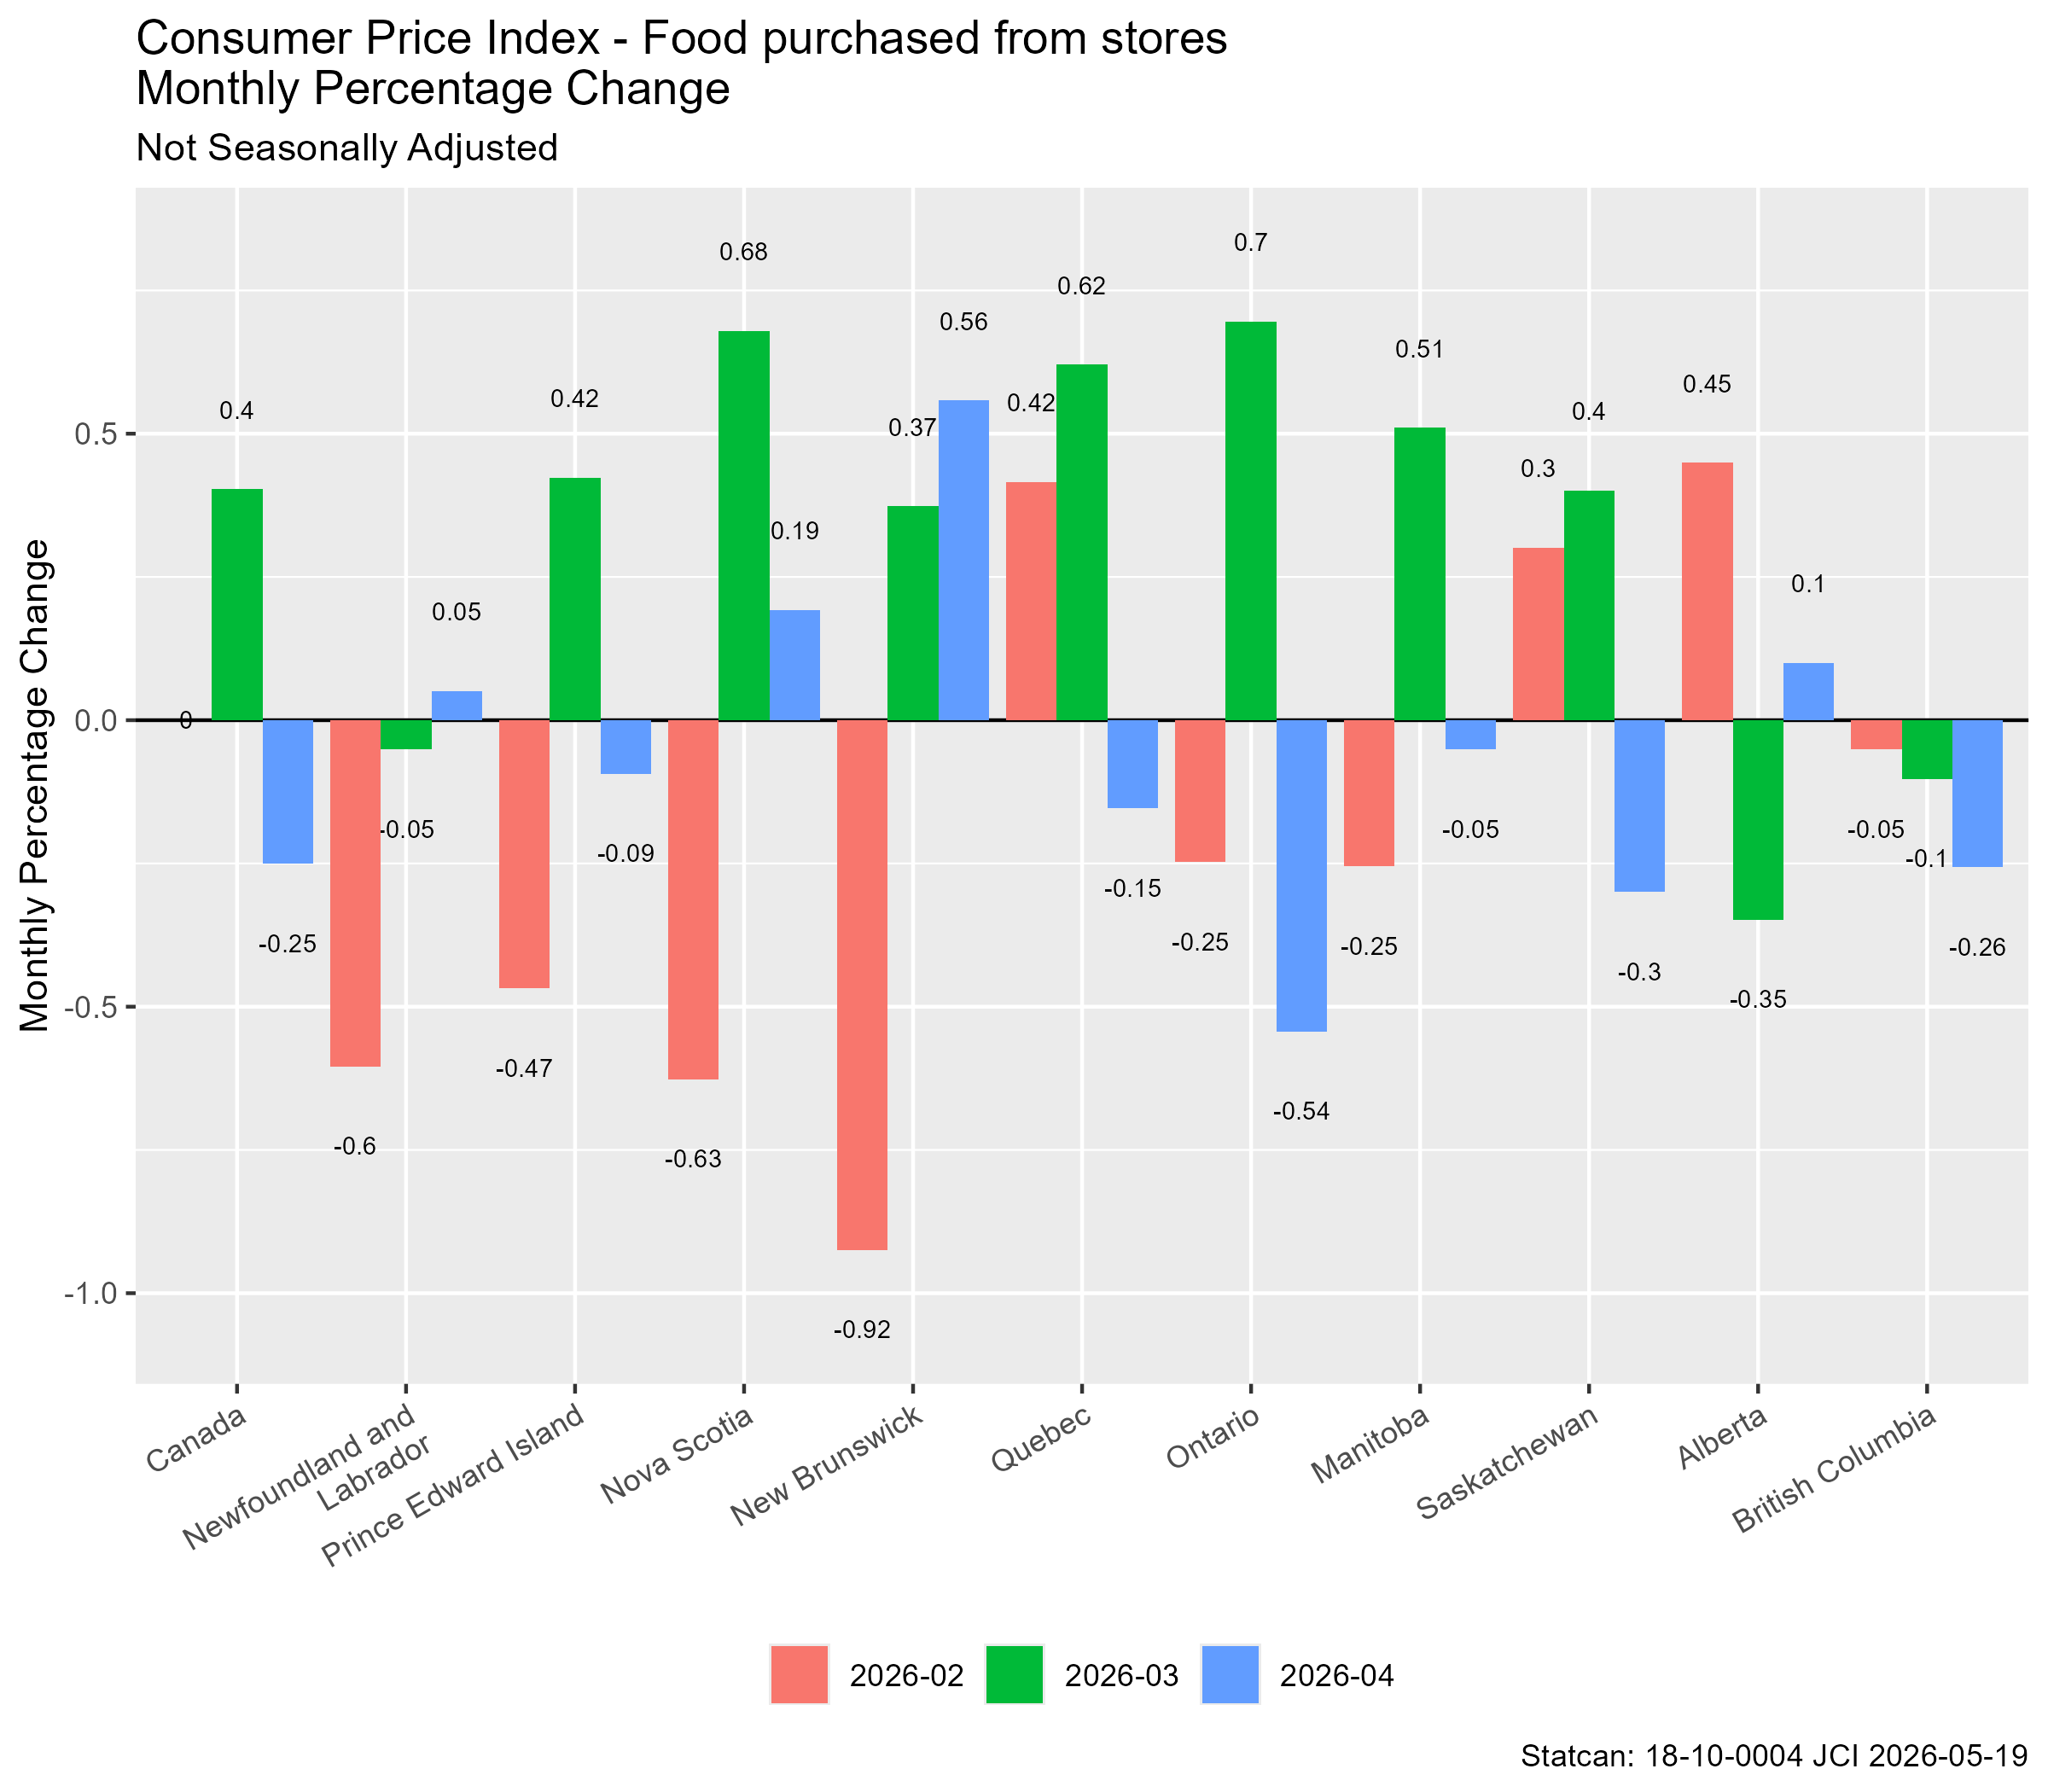
The detailed charts contain examples of provincial differences for key products.
Shelter
Fuel prices, notably fossil, are a key issue for shelter costs. However, natural gas prices are constrained.
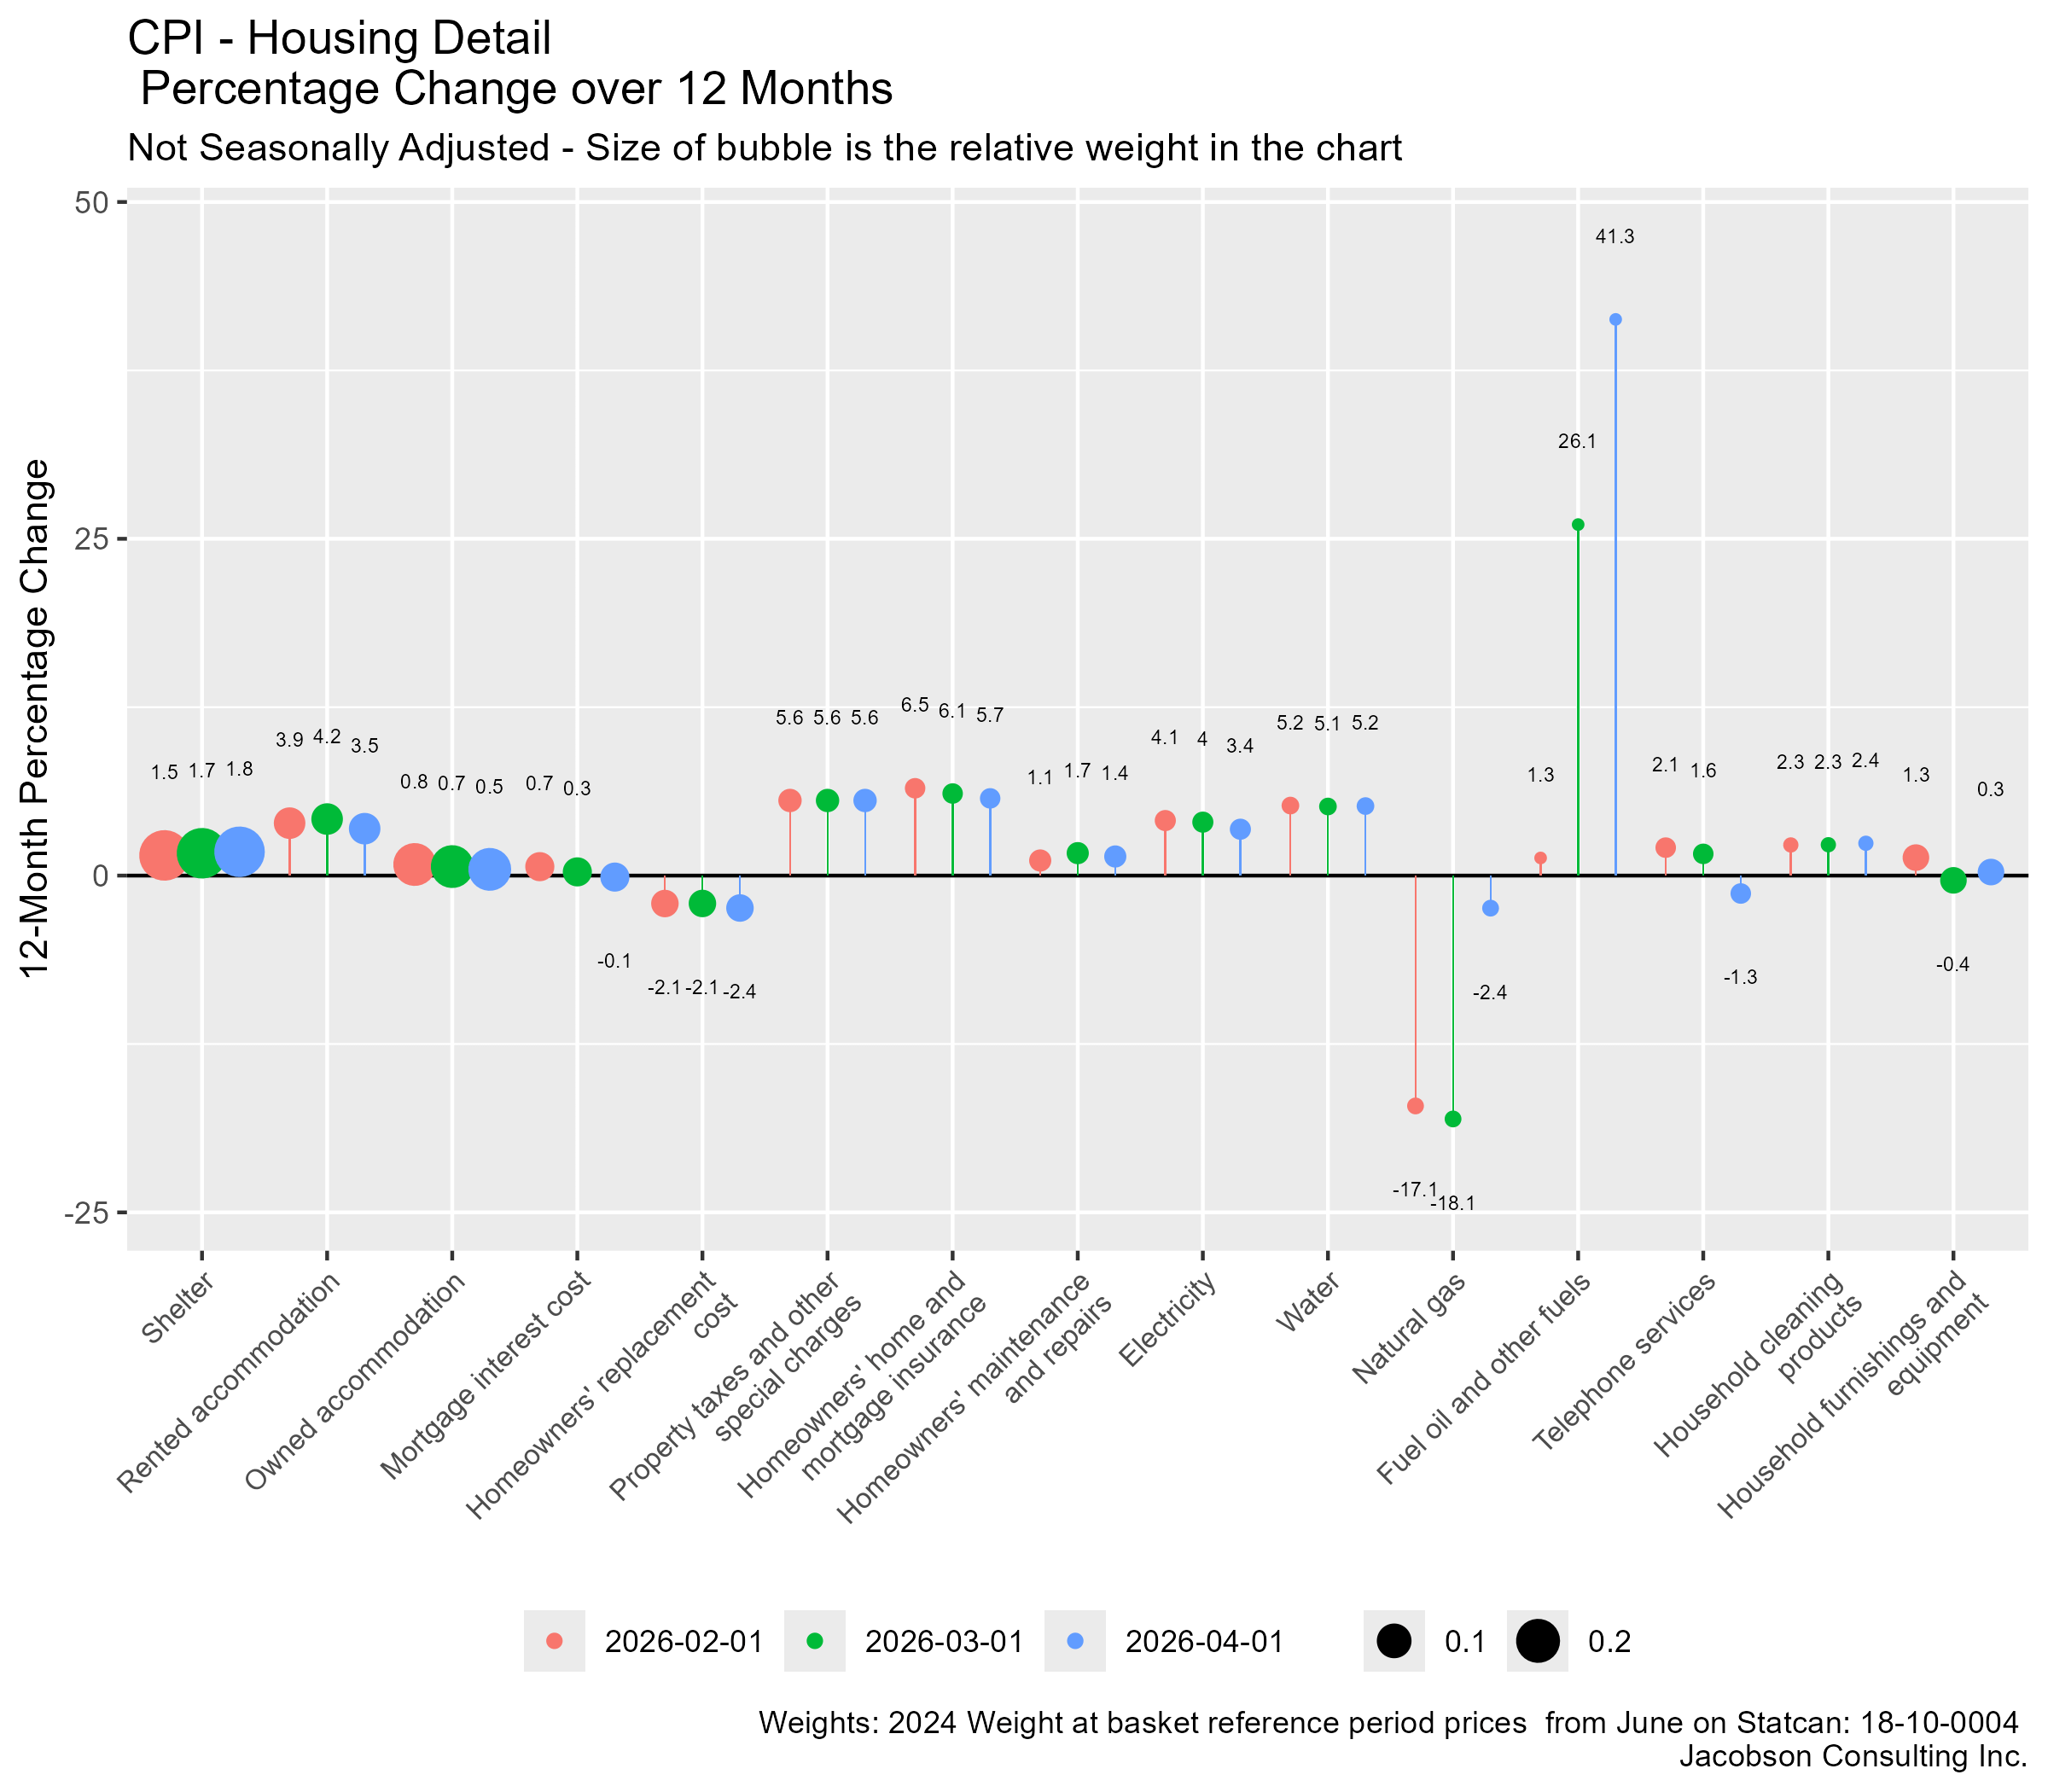
Property taxes and insurance costs continue to expand above the general rate of inflation. It is not clear that general monetary policy measures will manage these costs without creating other distortions.
The Daily notes the impact of the consumer carbon levy on price change. Price change will get distorted in the next few months will the temporary suspension of the federal fuel excise tax.
Clothing and Footwear
Price changes may be impacted by supply effects and by margin increases.
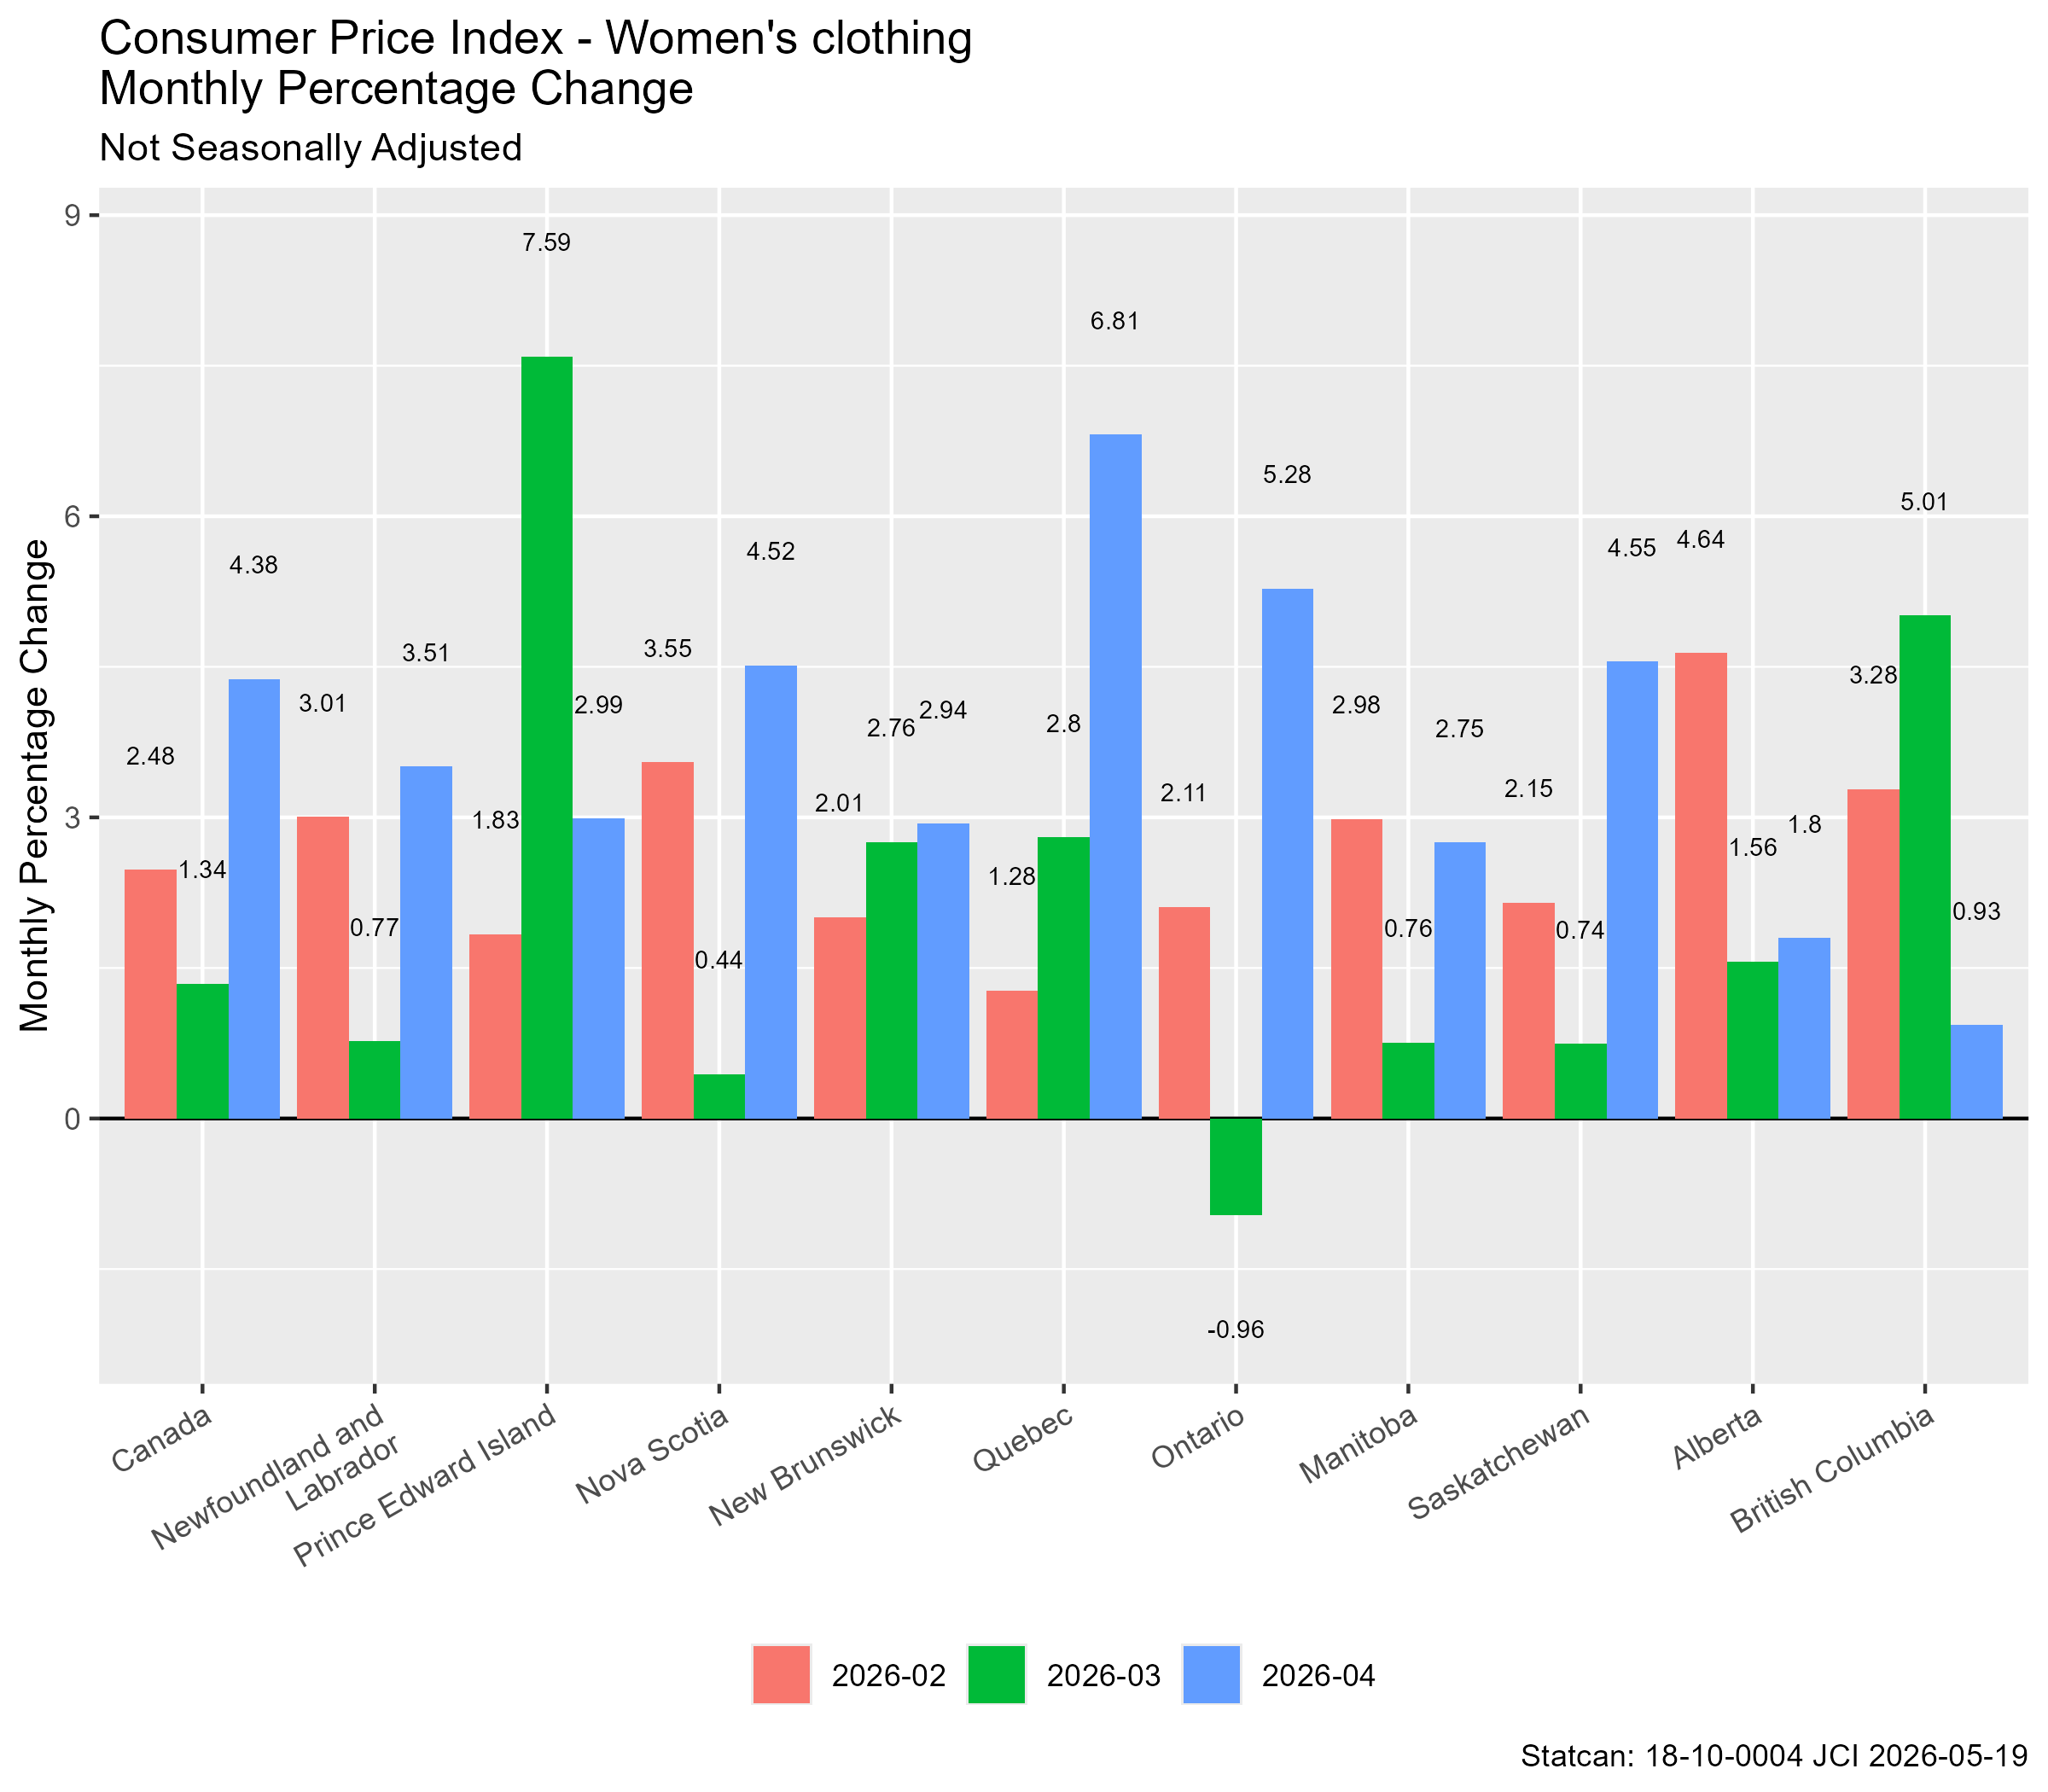
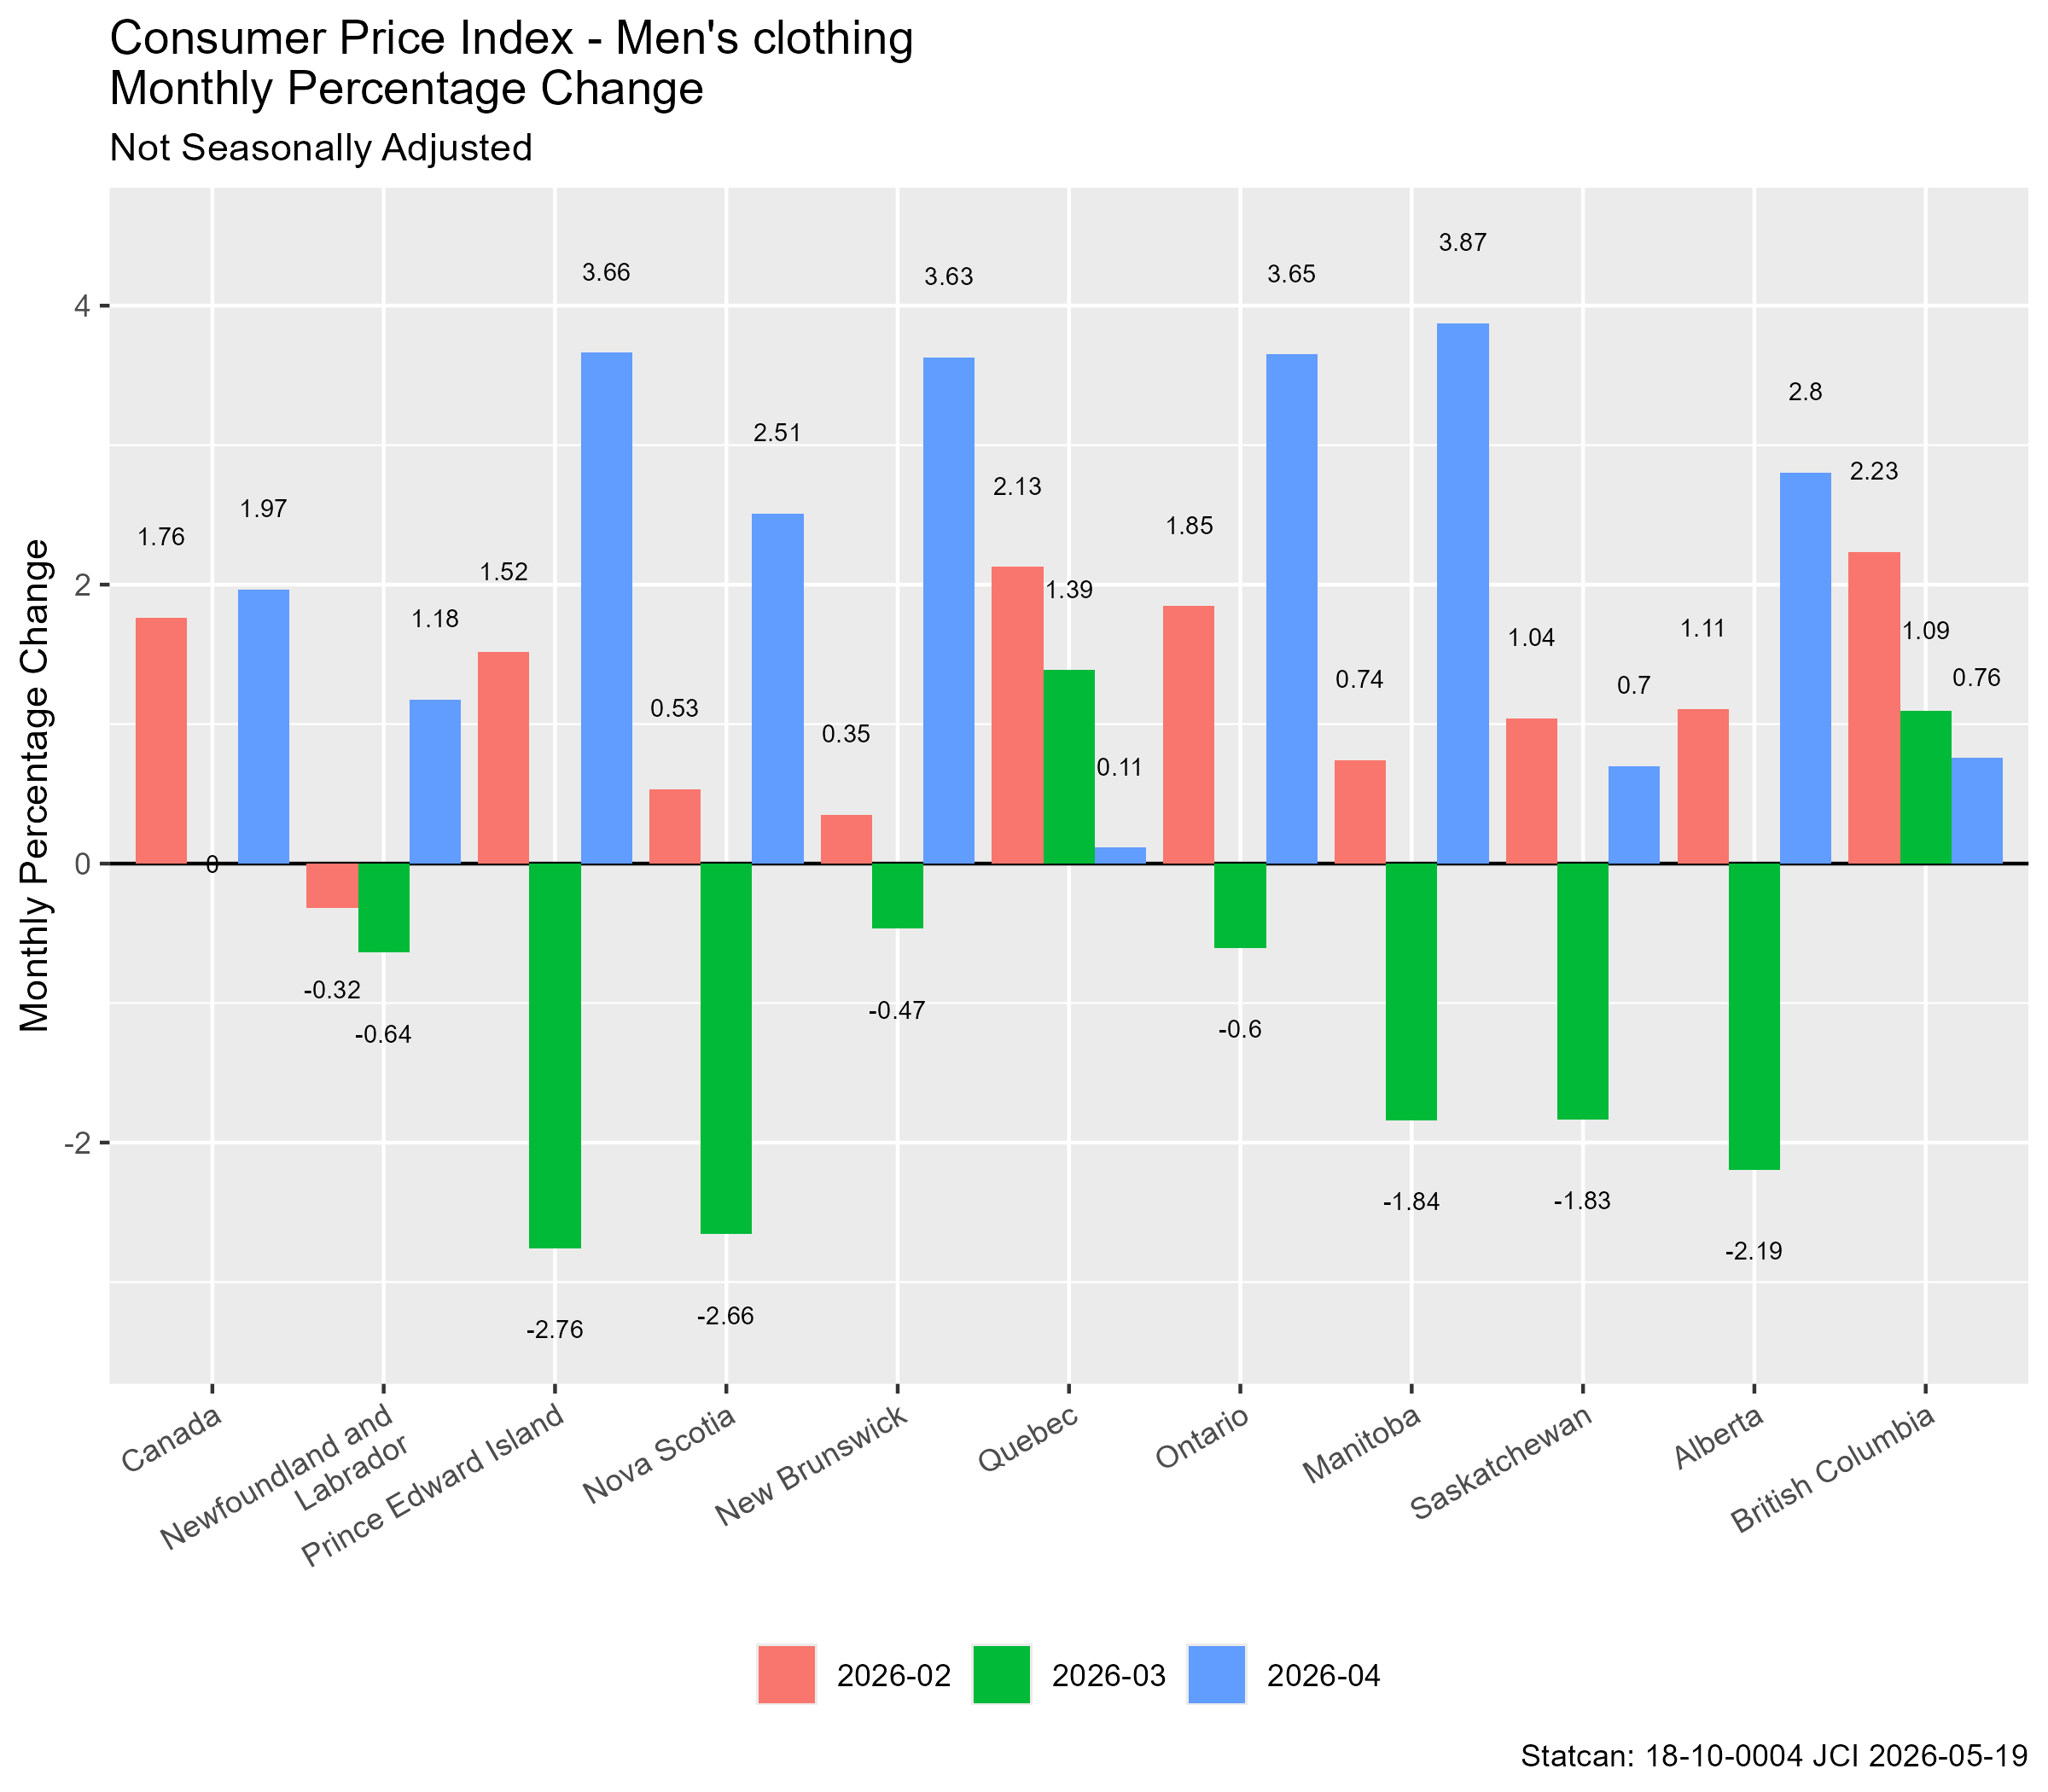
The volatility should noted. There may be current or anticipated supply issues because of transportation bottle necks.
Base-year Effects
The Daily has a useful discussion of the mechanics of base-year issues. The next chart shows the CPI on a 6-monthg frame.
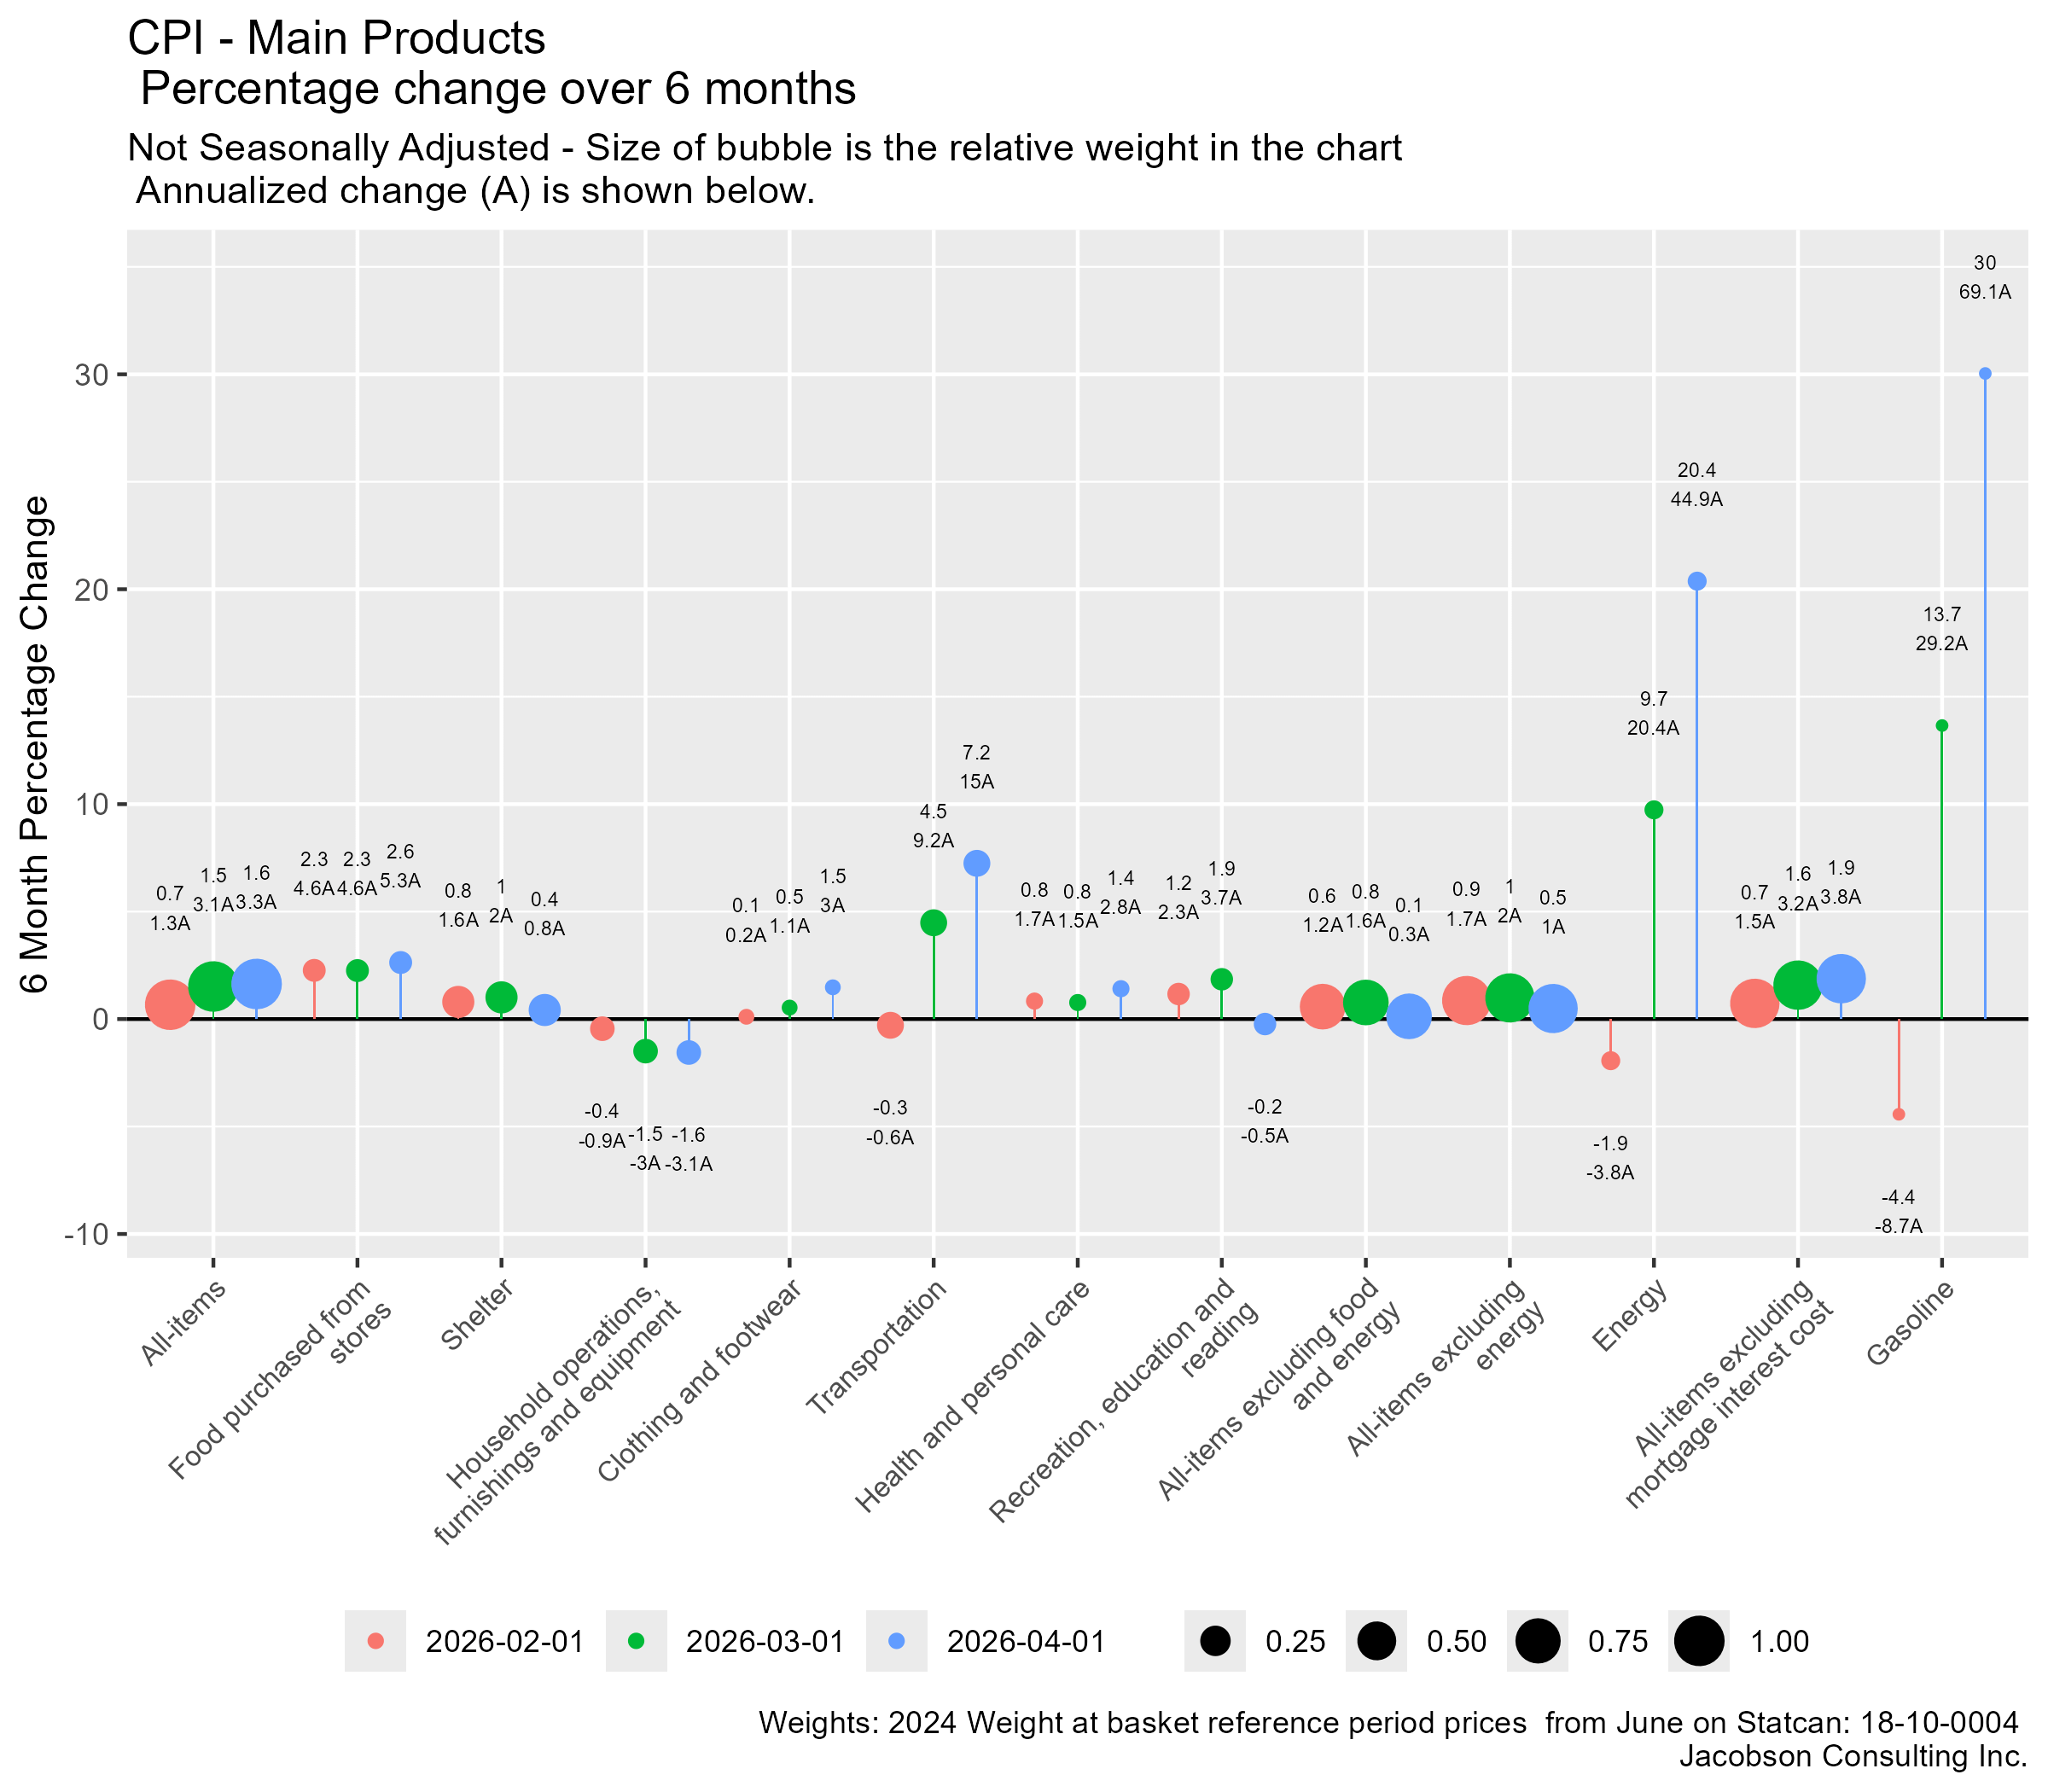
Excluding energy, the annualized change is definitely declining.
Detailed Charts
AI is not used. All charts and ideas are the responsibility of Paul Jacobsonssssssss