
An Eggy Tale
Supply management and good husbandry (biosecurity) have virtues

Introduction
The price of eggs has been part of the recent political debate. This note provides a brief overview of the egg situation in Canada and show that stable prices and good management (biosecurity) are virtues for a key food. Biosecurity refers to managing infection between birds and flocks.
Canadian Prices
The first two charts show the recent history of CPI estimates for egg prices. Supply management has stabilized producer prices but retail lack of competition and distribution costs mean that the provincial effects can be different. Retailing is a spatial concept. The only competition that matters is local not national. The lack of local competition in many markets is probably a factor in the price change.
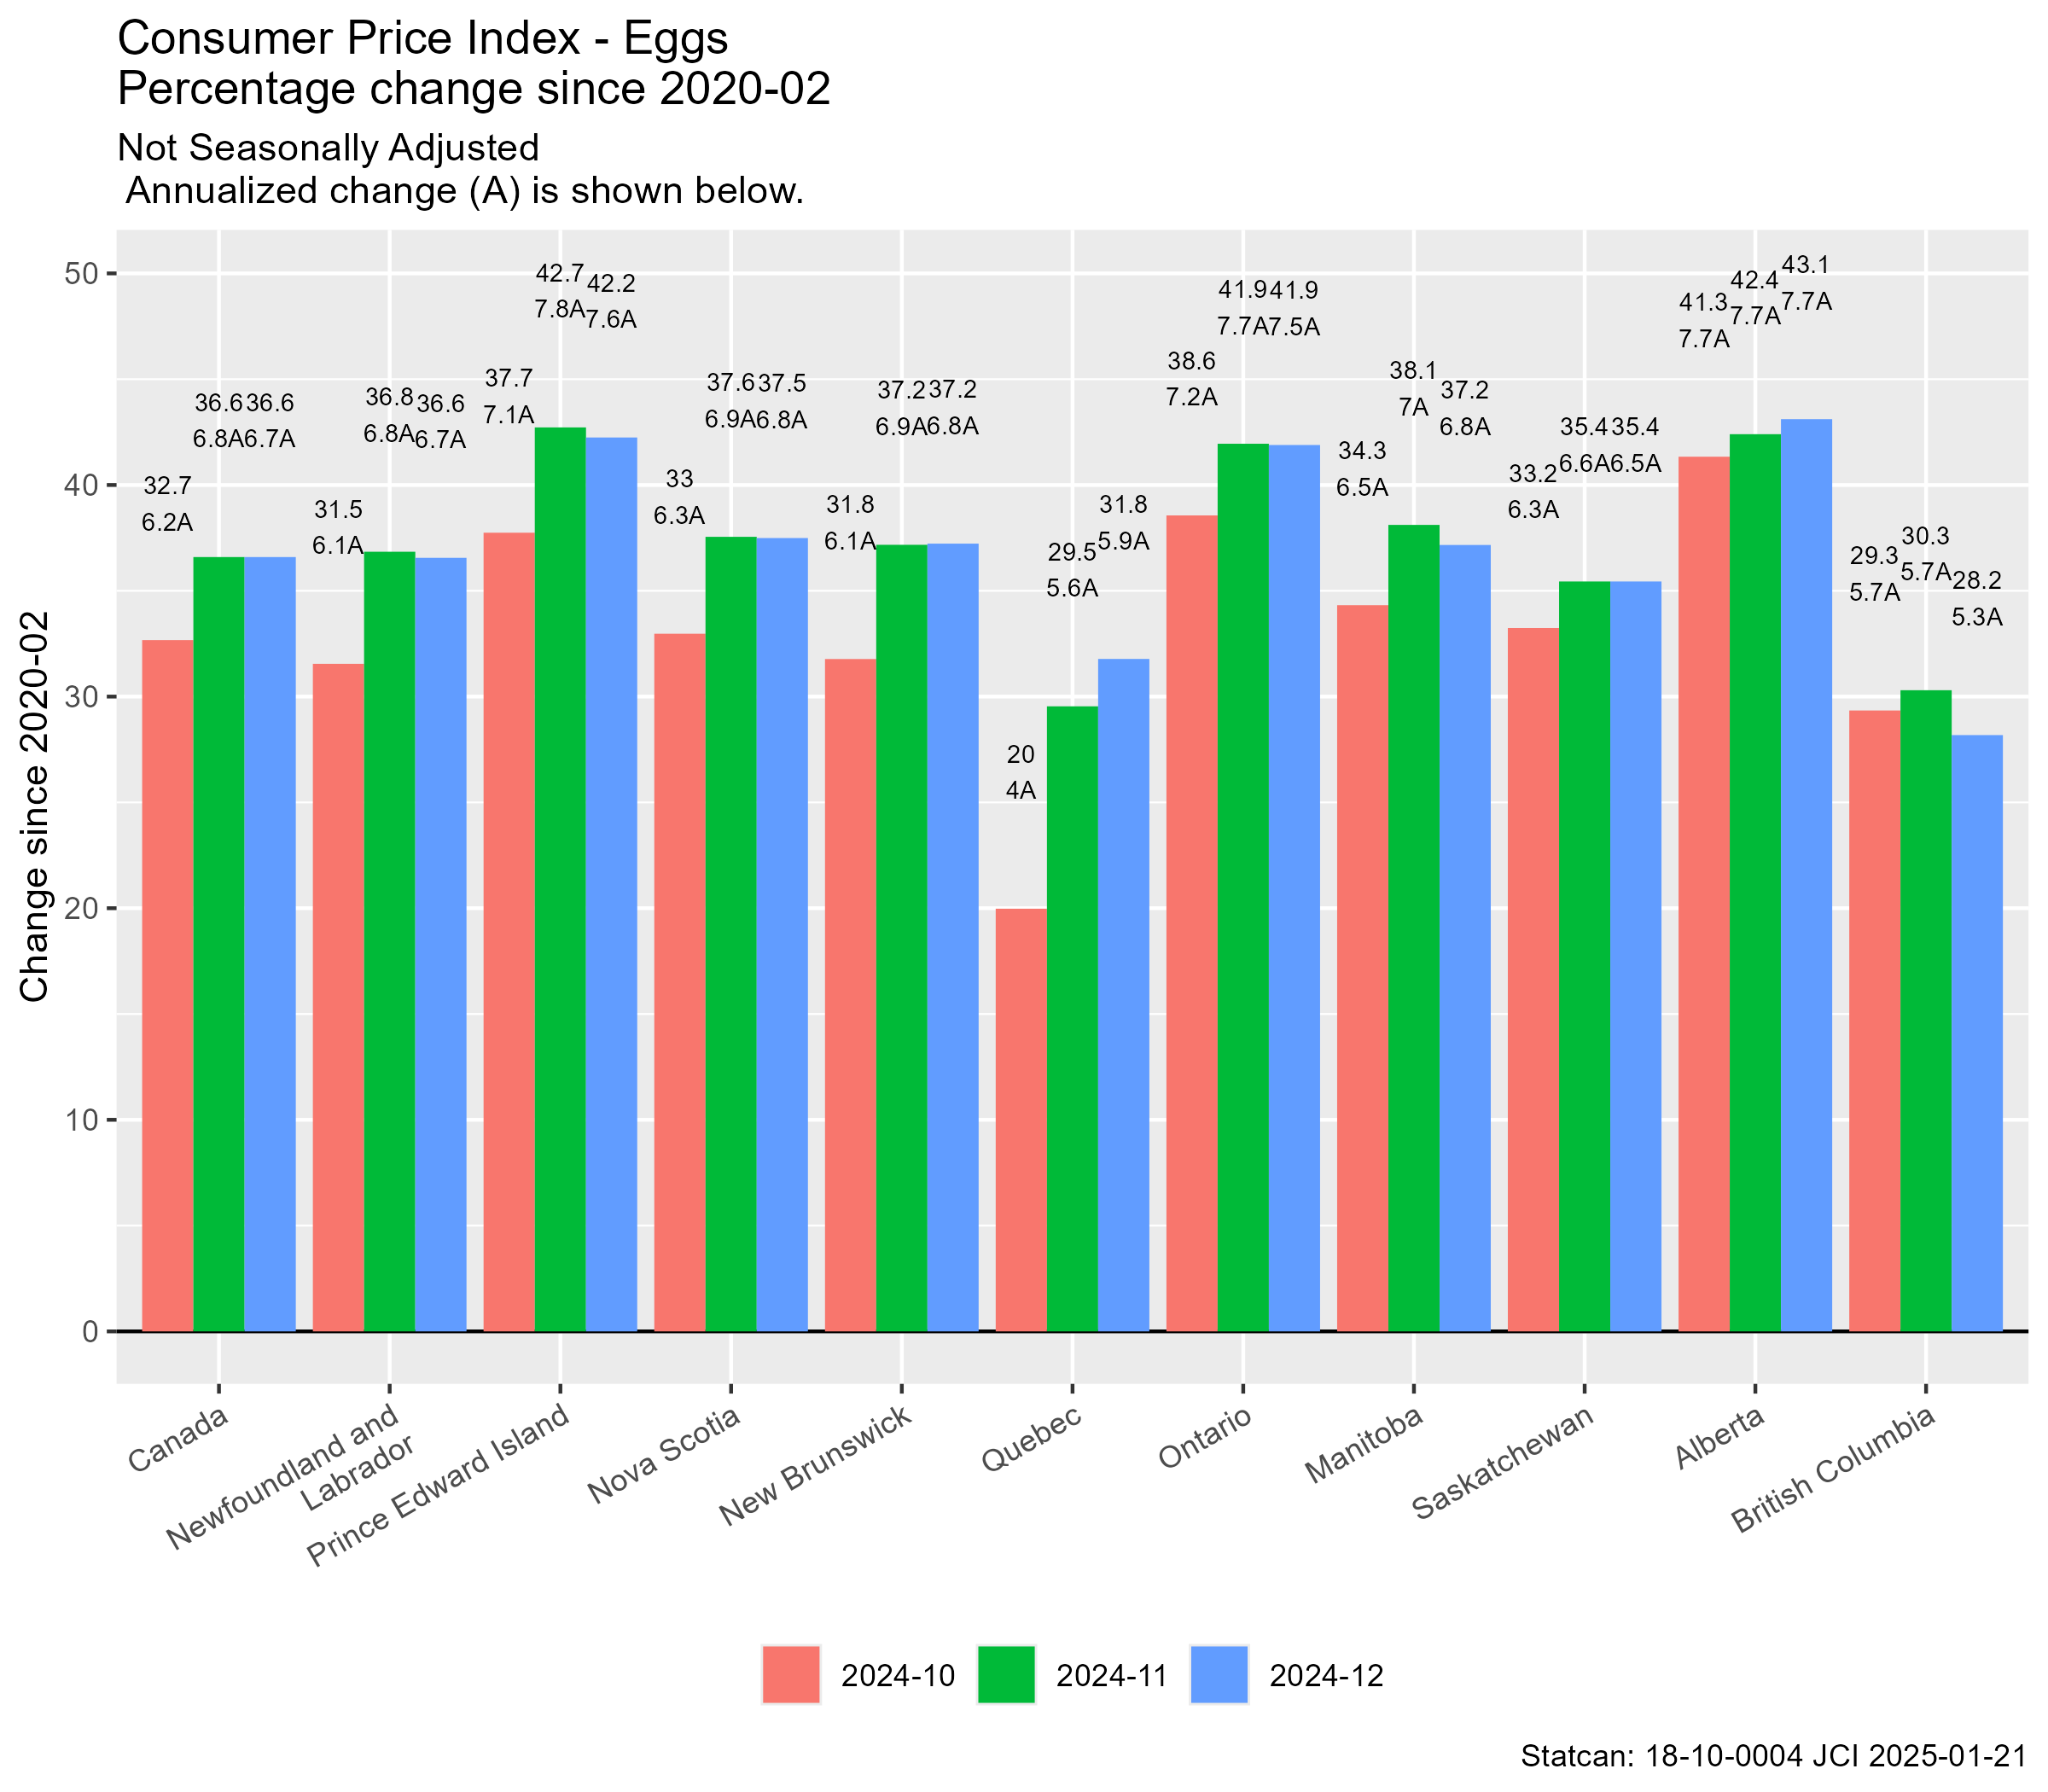
The first chart shows that average egg inflation has been slightly more than 6% per year nationally since 2020-02 with much lower increases in QU and BC. This highlights the consumer experience.
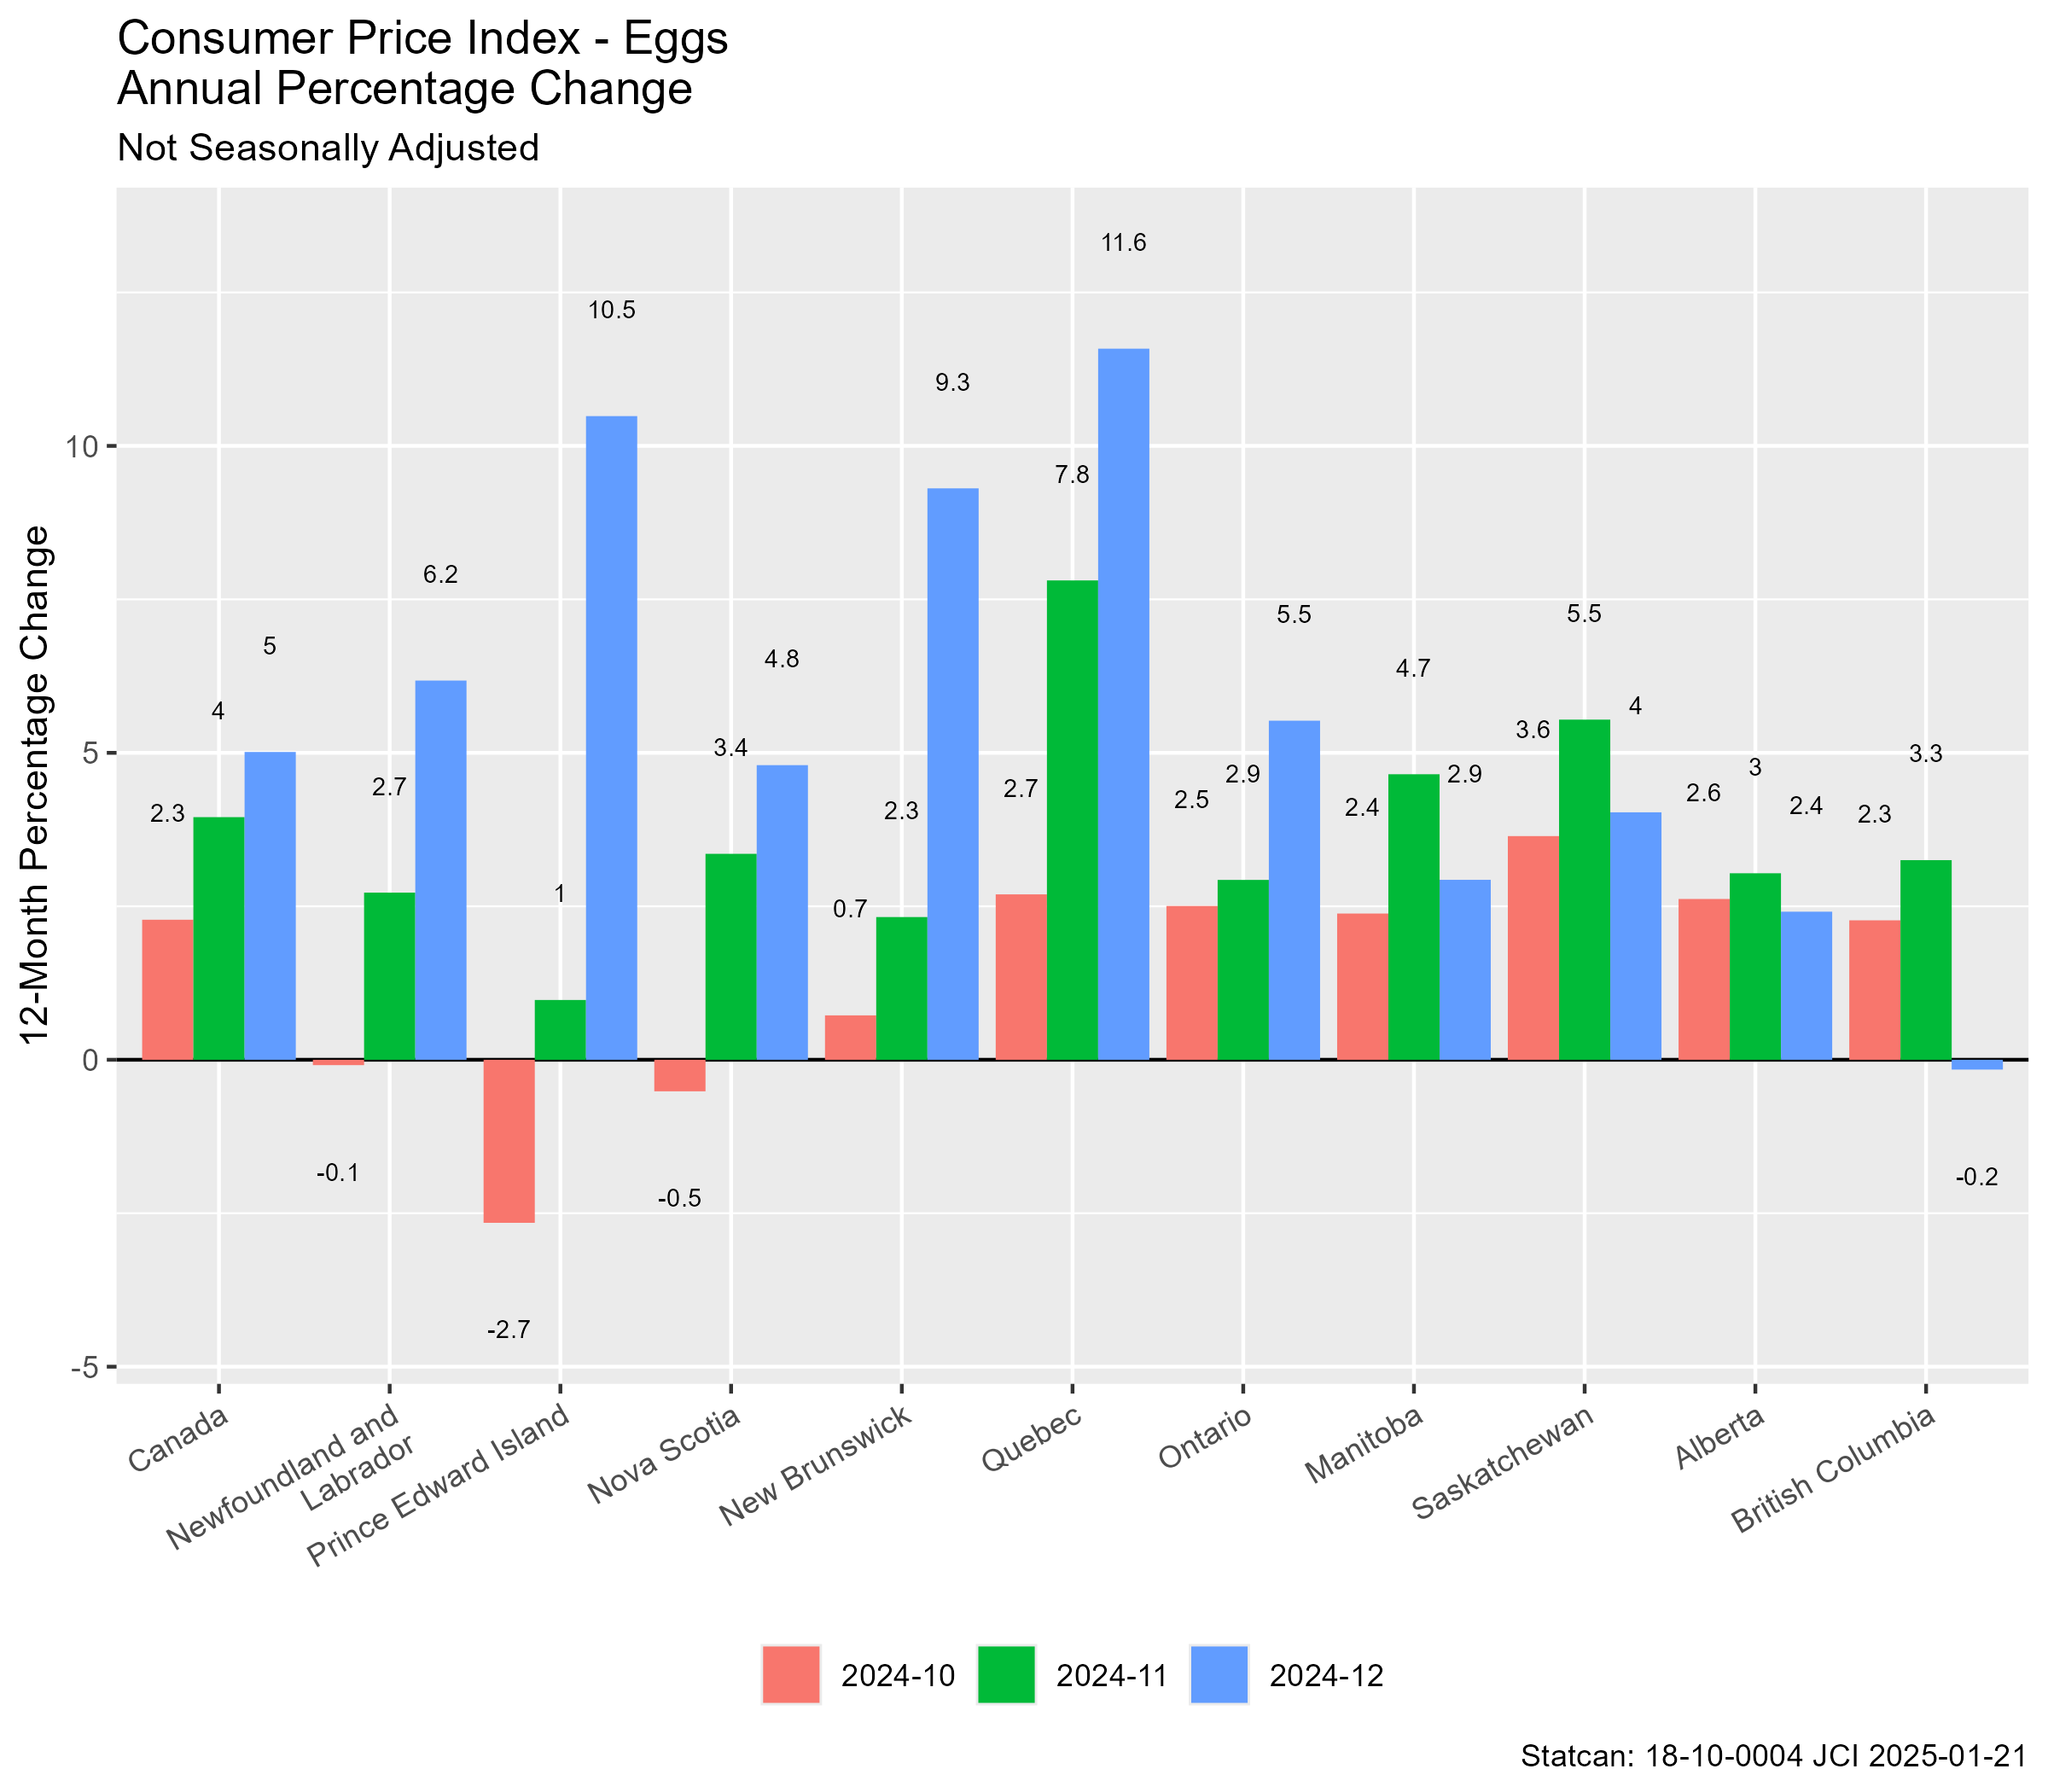
The second chart shows the annual inflation rate with rather more recent volatility in eastern Canada than the west. Producer prices (price to the distributors) are managed at the provincial level with powers delegated nationally on a supply management (quota) basis with cost increases so that the efficient producer gets a fair return.
Supply Management Overview from an Ontario perspective is available at this link.
Canada - US Egg Price Comparison
The next charts compare the retail prices for eggs in the two countries with an exchange rate adjustment. The growth rate (second chart) variant is probably the most useful for analysis but the levels provides a good perspective as well. These estimates are based on average retail prices across a range of egg products. This is less rigorous than the approach used to measure inflation in the CPI.
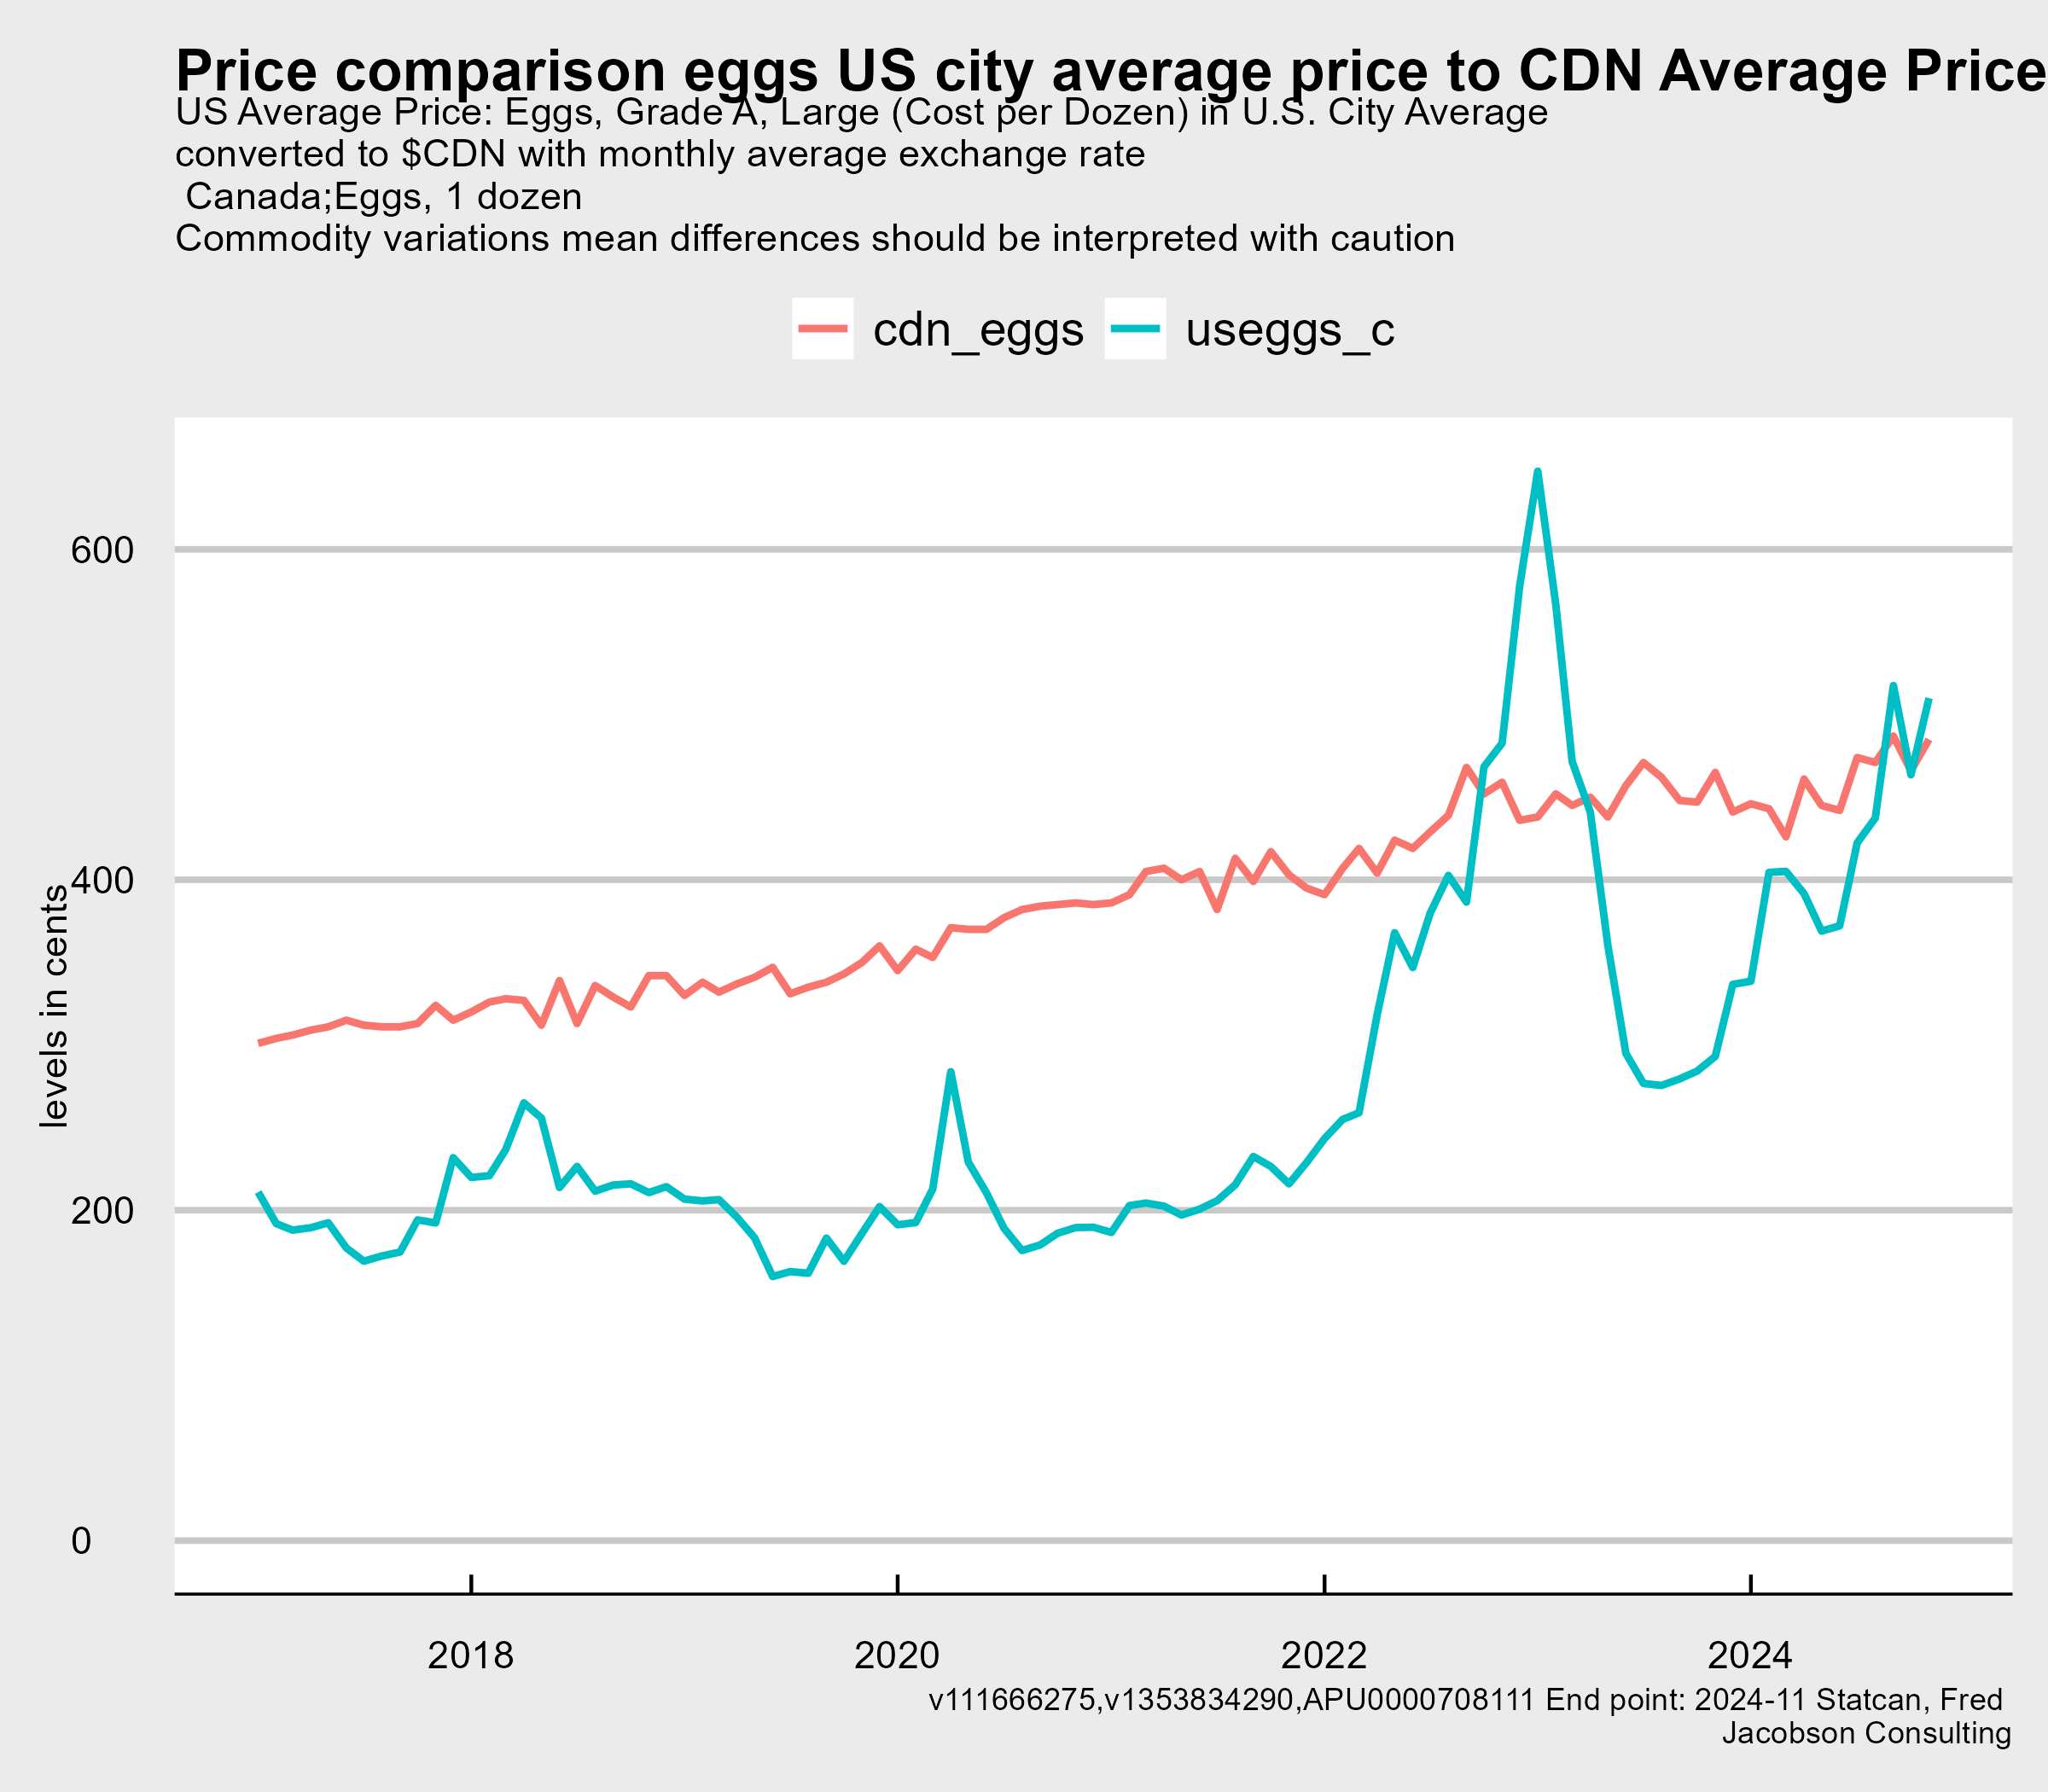
The levels chart shows that average price is relatively similar now but that US volatility has been substantially higher because of the lack of a supply management regime and serious biosecurity issues. The initial impact of avian flu is seen the in major volatility in early 2022.
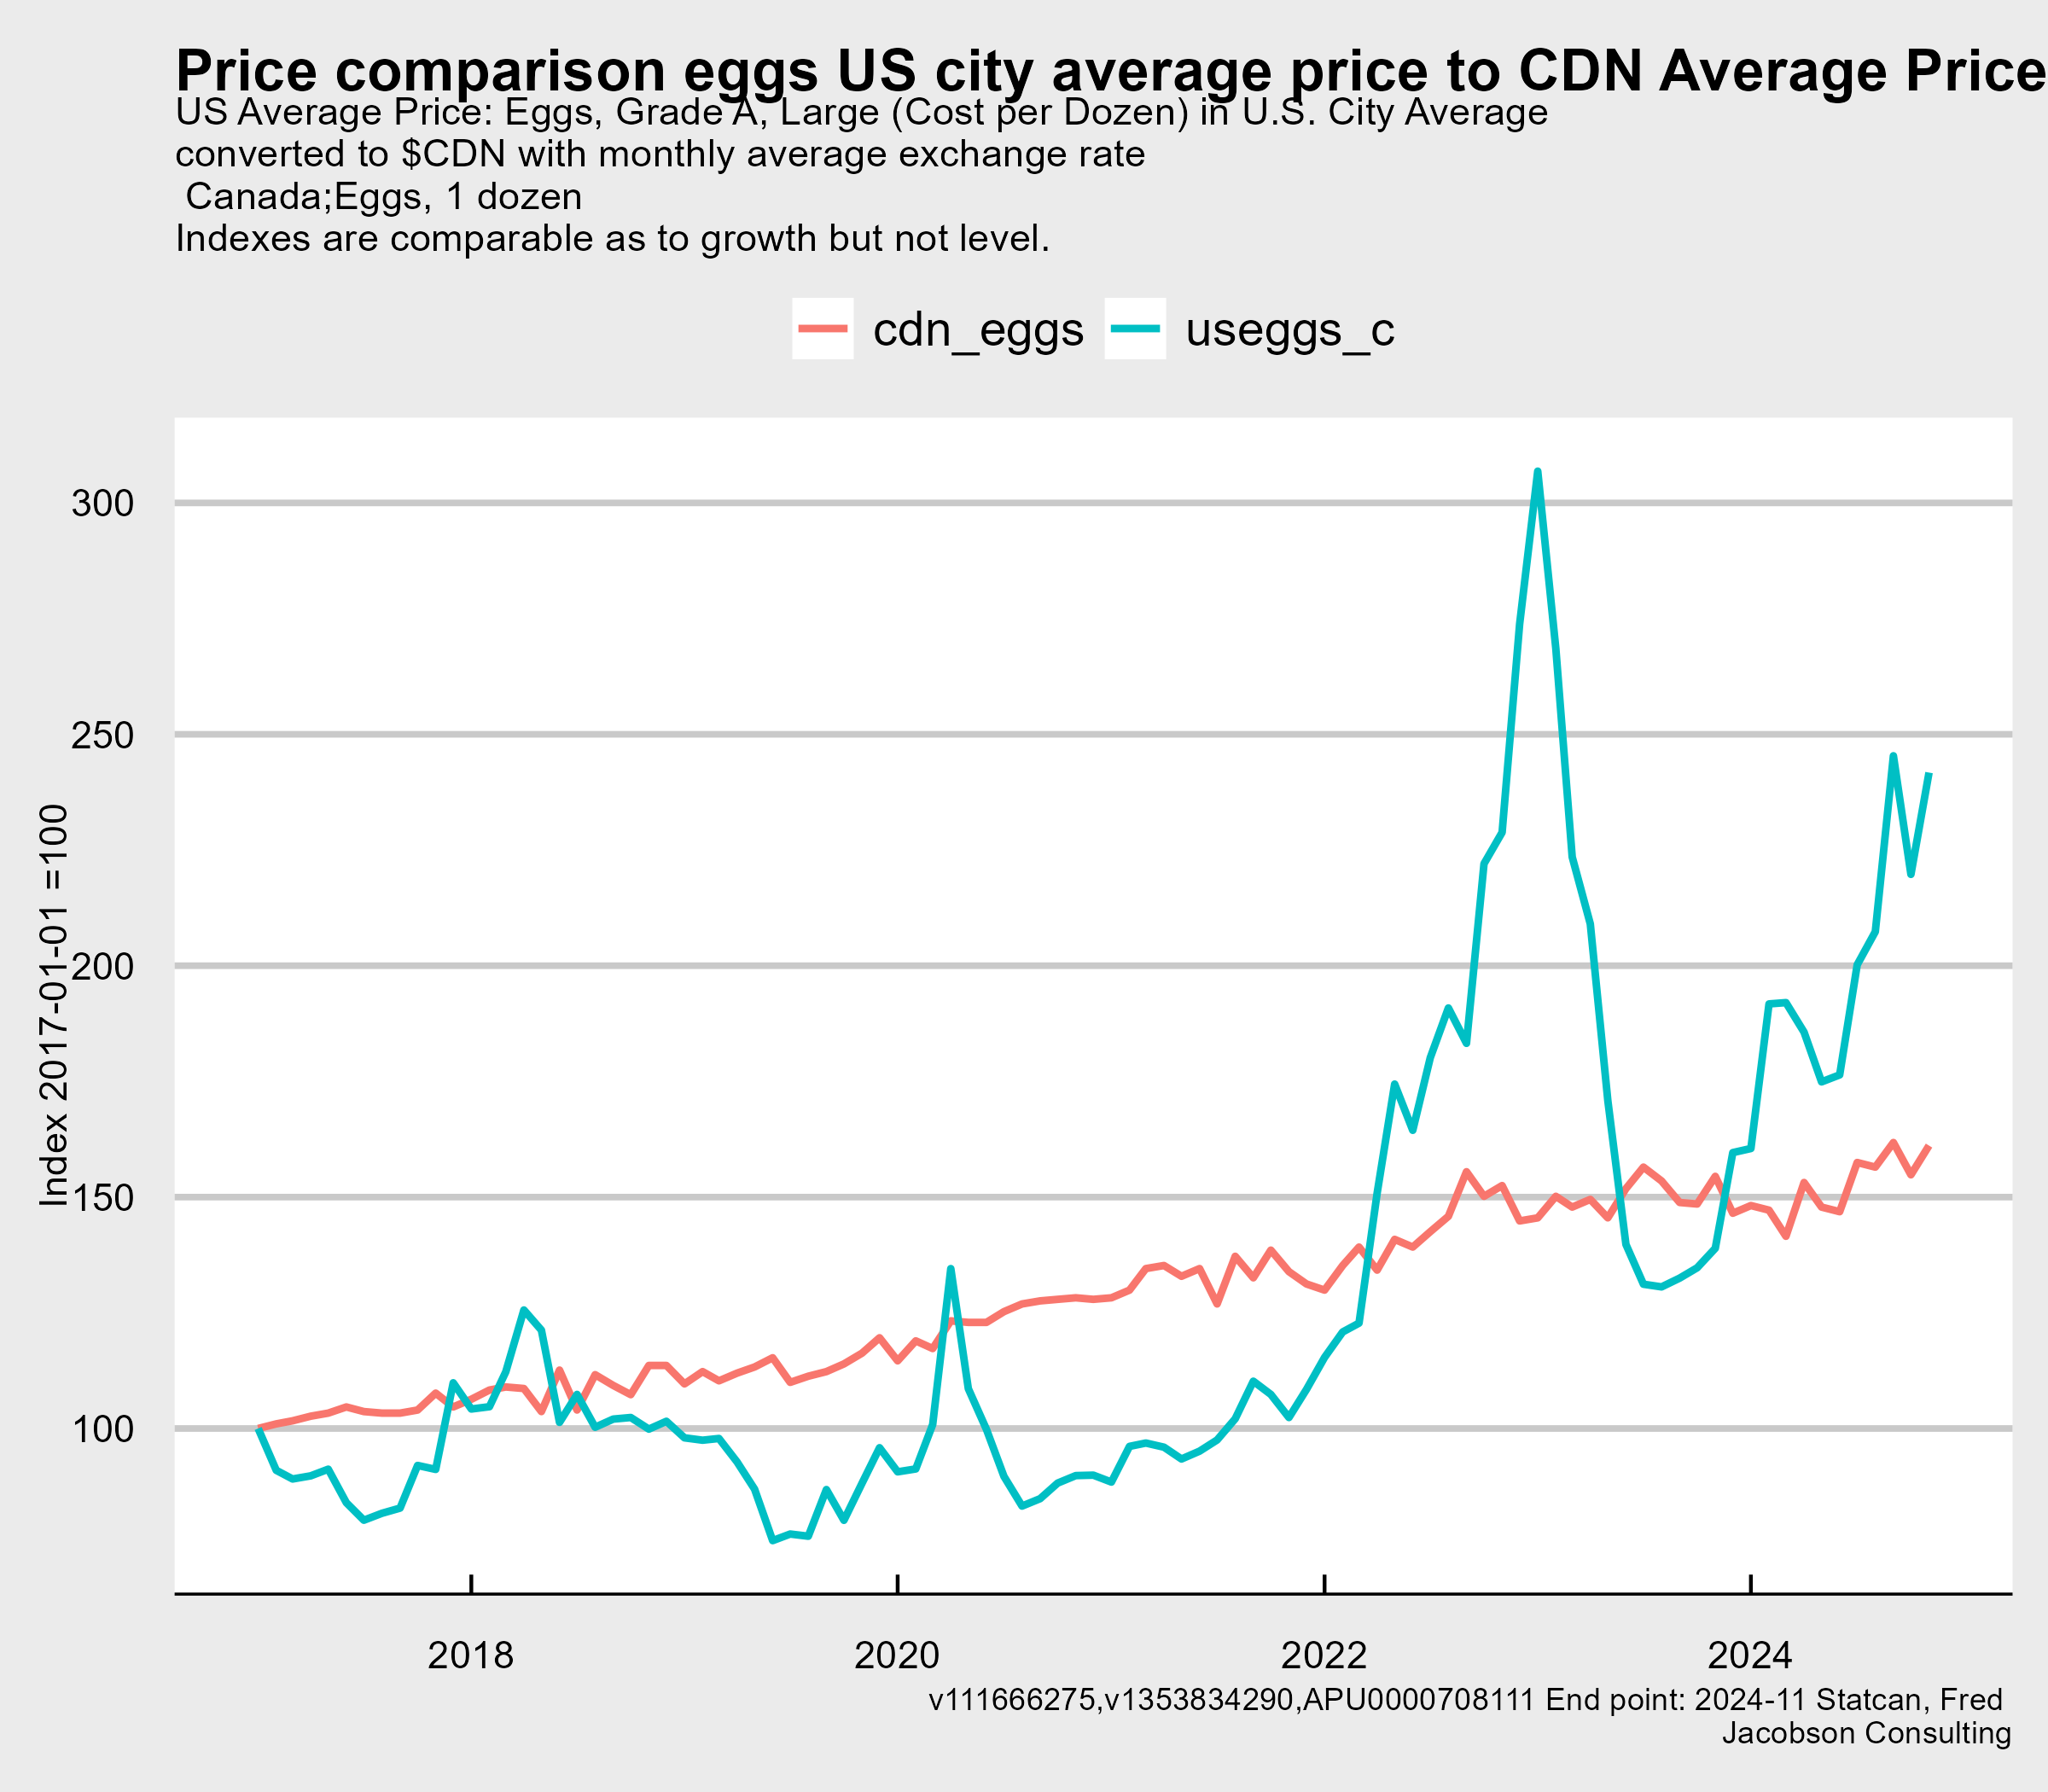
The second index chart shows that growth rate in the two countries to focus on the volatility and recent growth. The challenges facing US consumers are obvious.
Feed for layers is dominantly grain. The various supply restrictions probable had some impact in 2022 in Canada. However, the onset of the avian flu is the main driver, particularly in the US.
Provincial Distribution
Egg production is broadly local and is administered at the provincial level. The charts below show the provincial shares and the levels of the number of layers (hens).
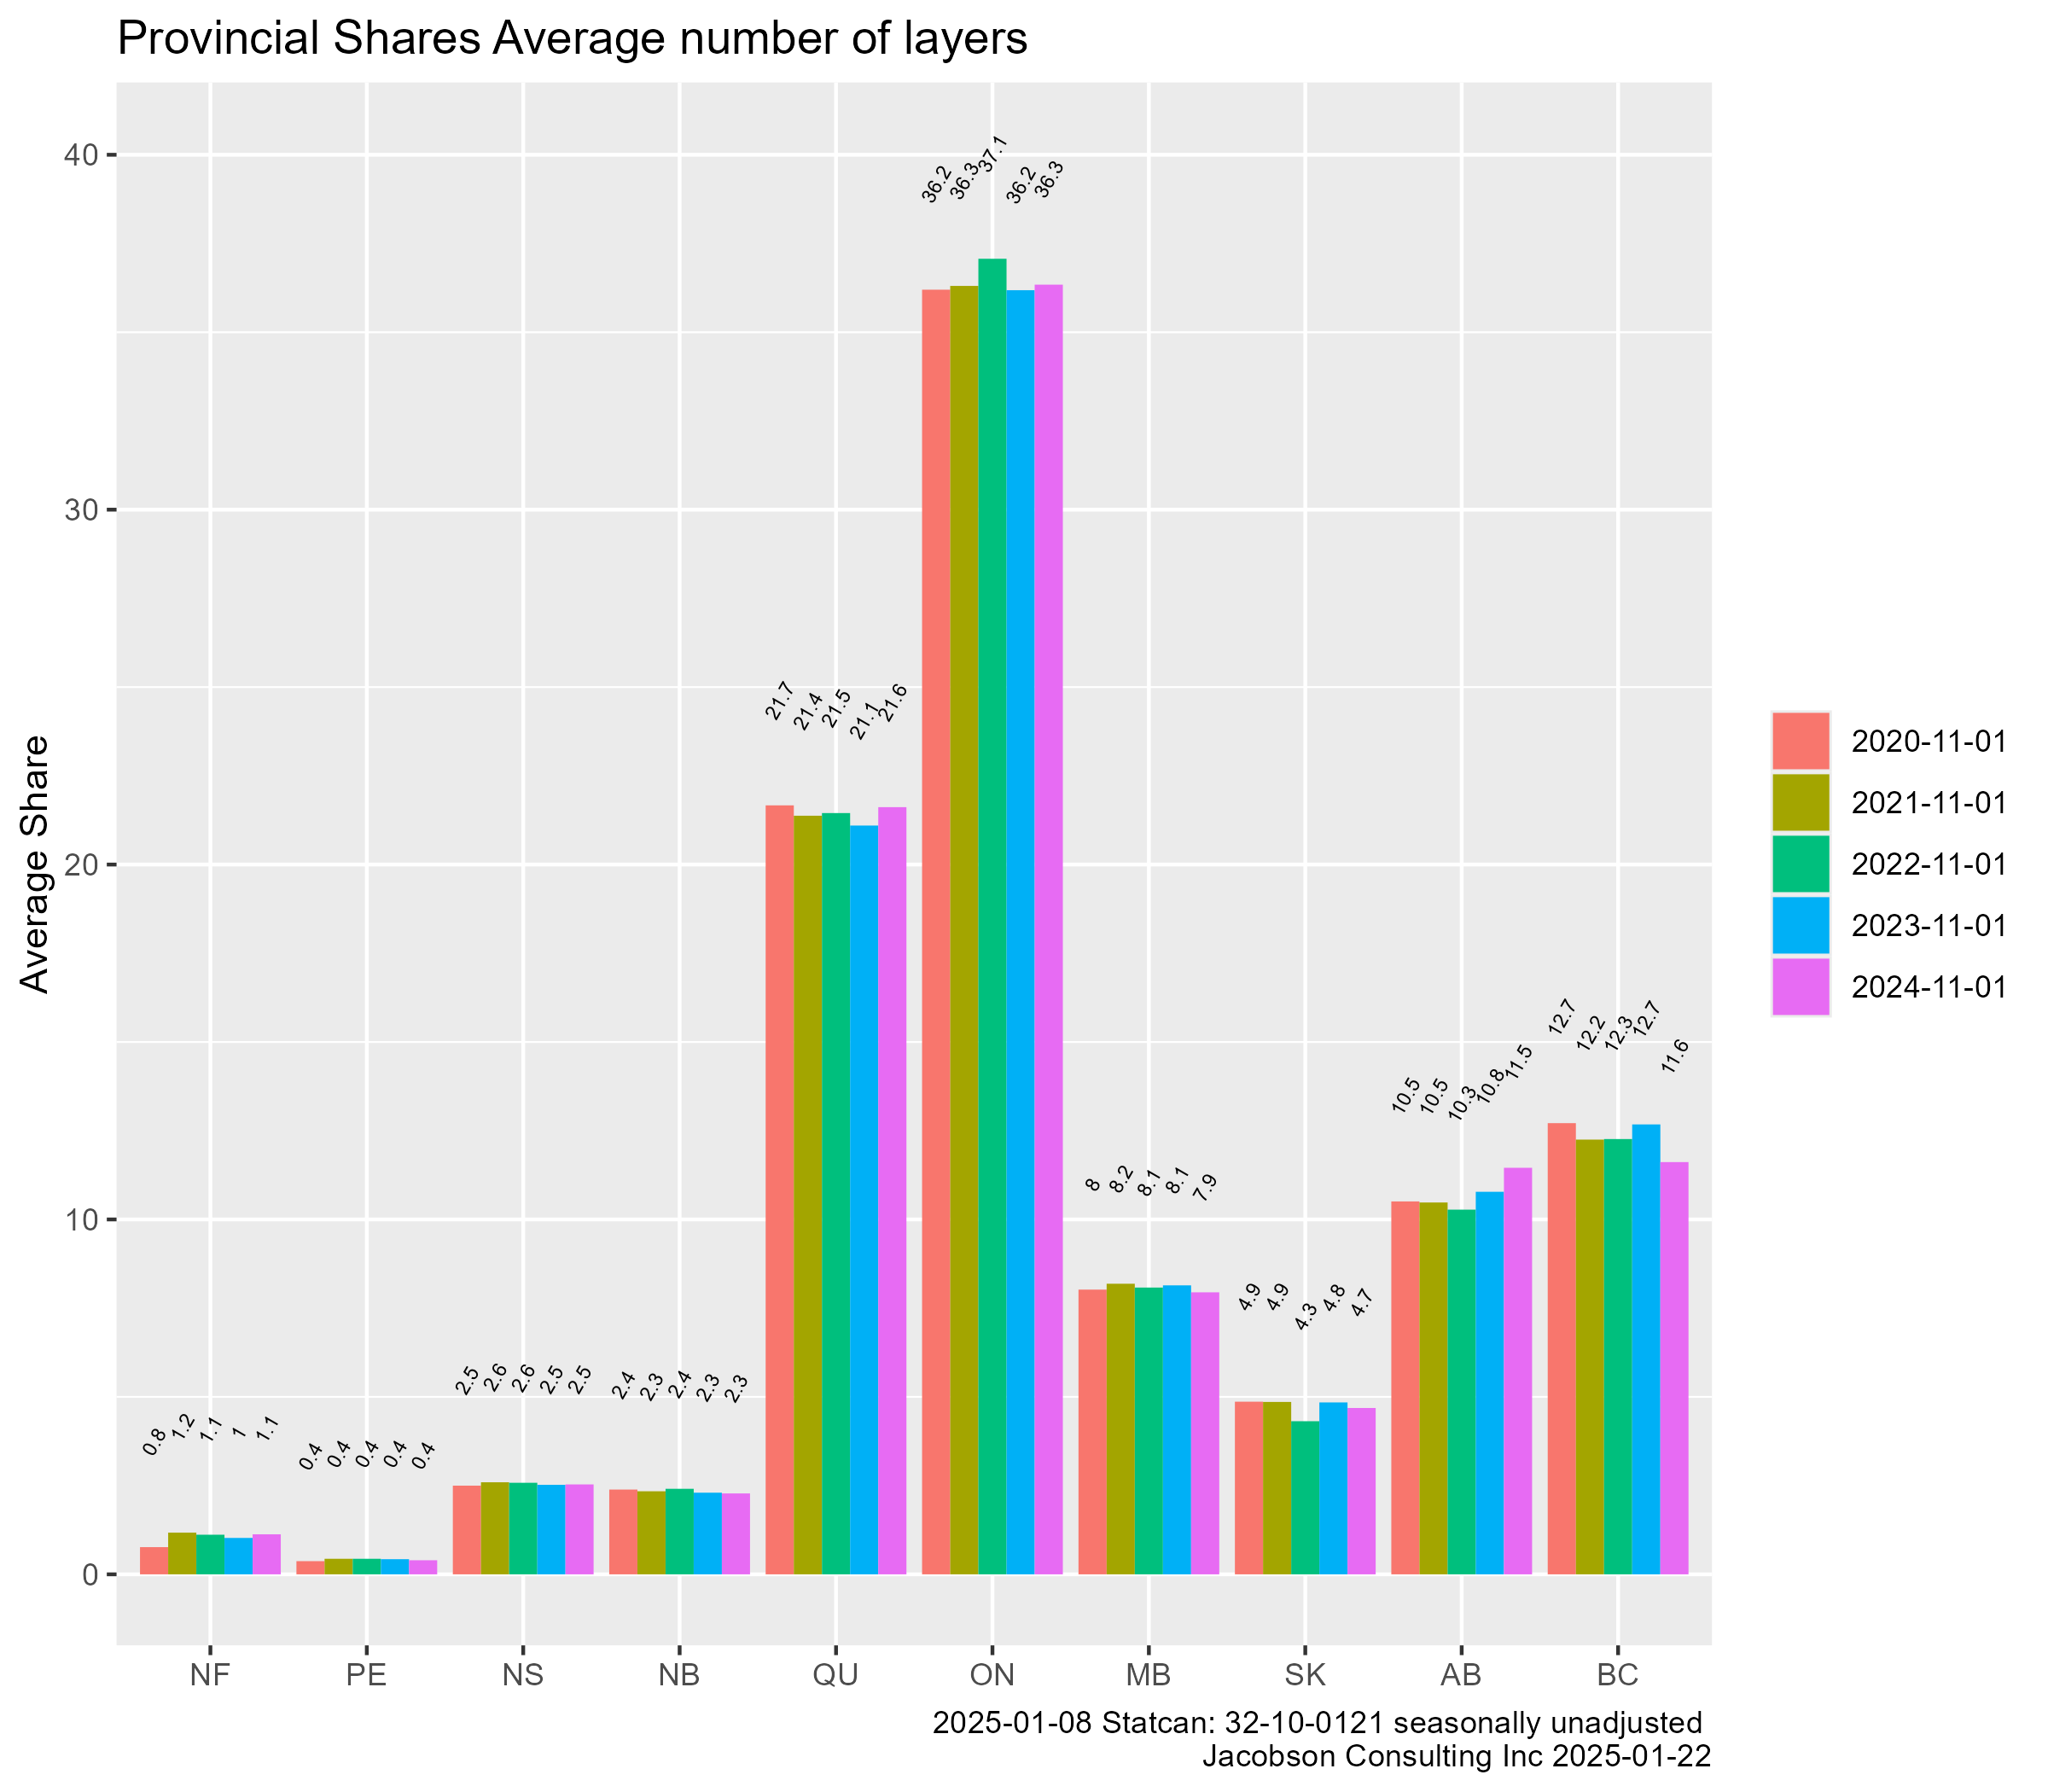
The next chart shows the actual number of layers.
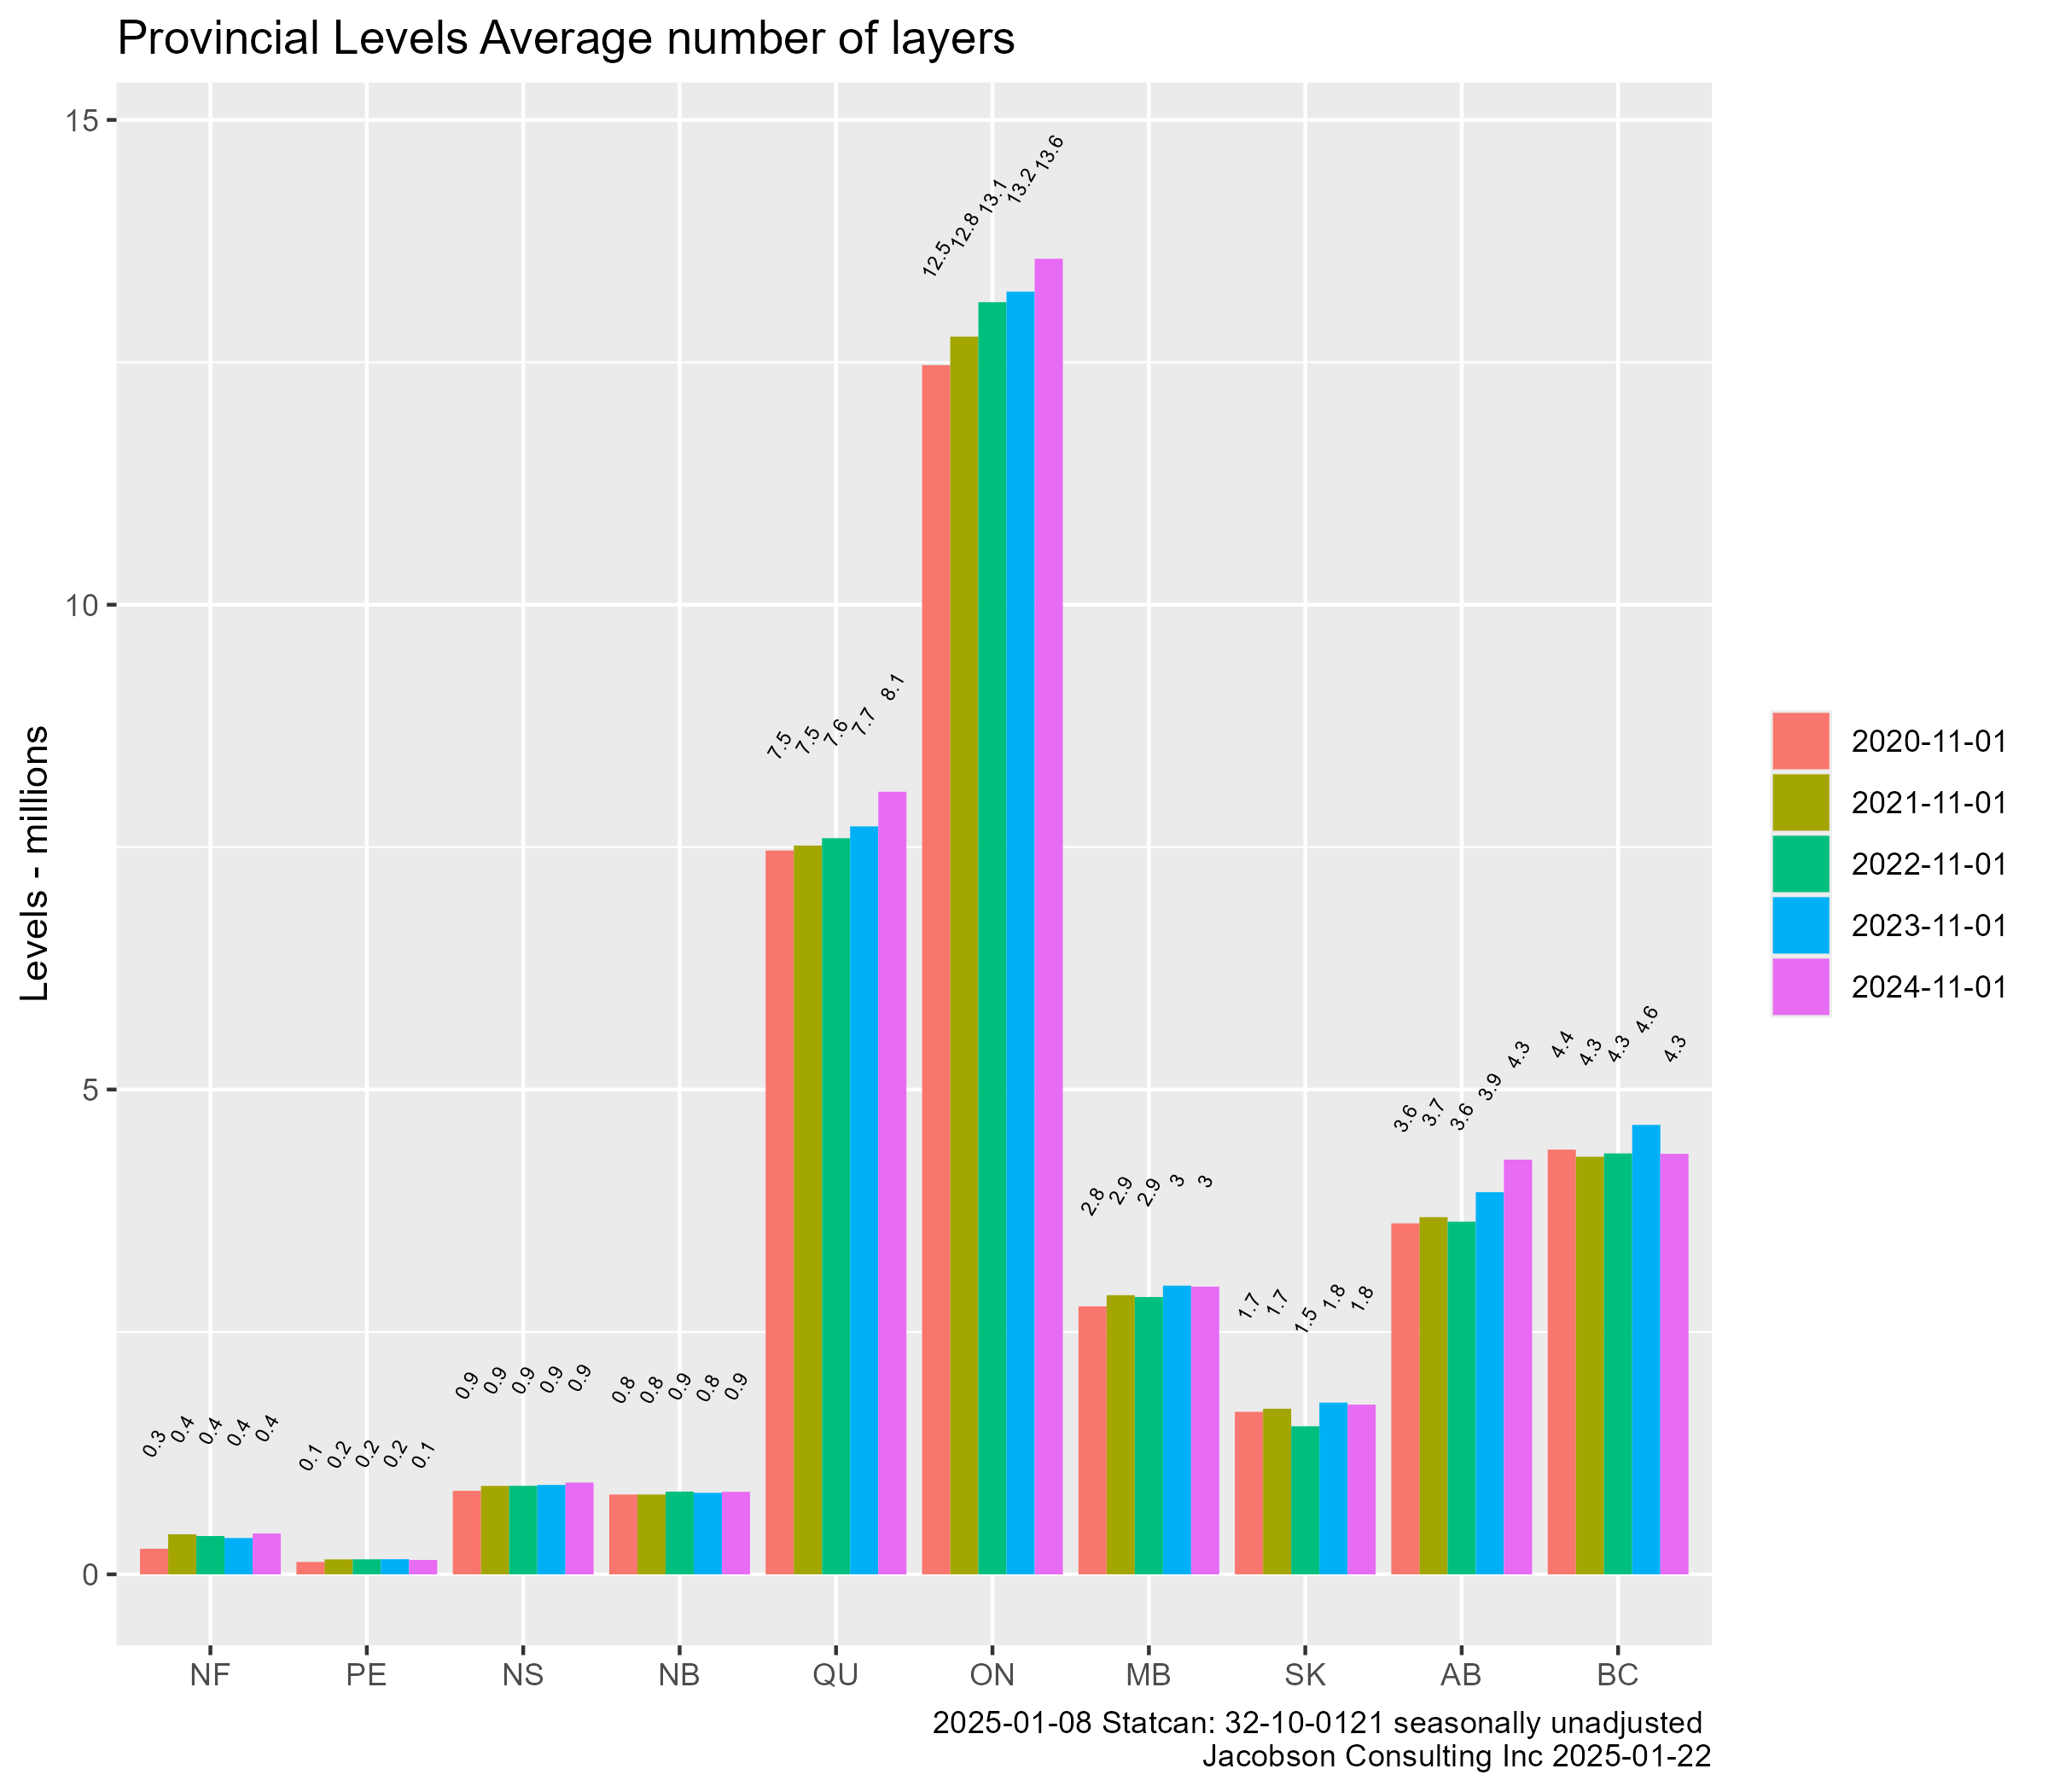
The distribution is roughly proportionate to population and the growth in the number of layers reflects the management to fulfill domestic needs. The important takeaway is that the number of layers in BC is much less than in ON. This is relevant when comparing Avian flu issues by province.
Avian Flu
Avian flu has been a big issues since early 2022. It appears to be dominantly an issue of exposure to the virus transmitted by wild birds and other animals. It is managed by biosecurity measures (cleanliness and husbandry) which control the transmission of infection between flocks.
Avian flu has been a big factor in the evolution of prices in the US resulting in severe shortages when large flocks had to be destroyed. In the context of this discussion, avian flu is focussed on the subtype H5.
Canadian Experience
The table below was developed from inspection data in Canada.
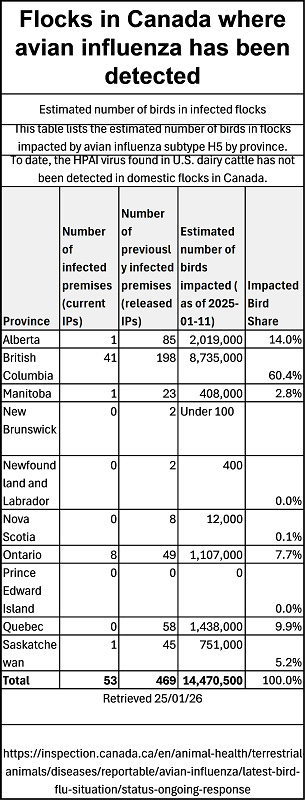
The share shown is the share of the total national impacted birds. One important point is that the share of birds infected to date is not proportional to the share of layers in Canada shown above. BC has 60% of the impacted birds but the average BC number of birds is only slightly less than 13% of the Canadian total number of birds.
The number of infected premises is dominantly in BC. This suggests some differences in biosecurity practices in BC and ON. A premises infection means a replacement of the stock of layers which is a major cost to producers and a supply issue which affects prices. However, relative to the stock of layers in Canada, the issue is small with a minimal impact on price.
The next chart shows the average level of prices by province.
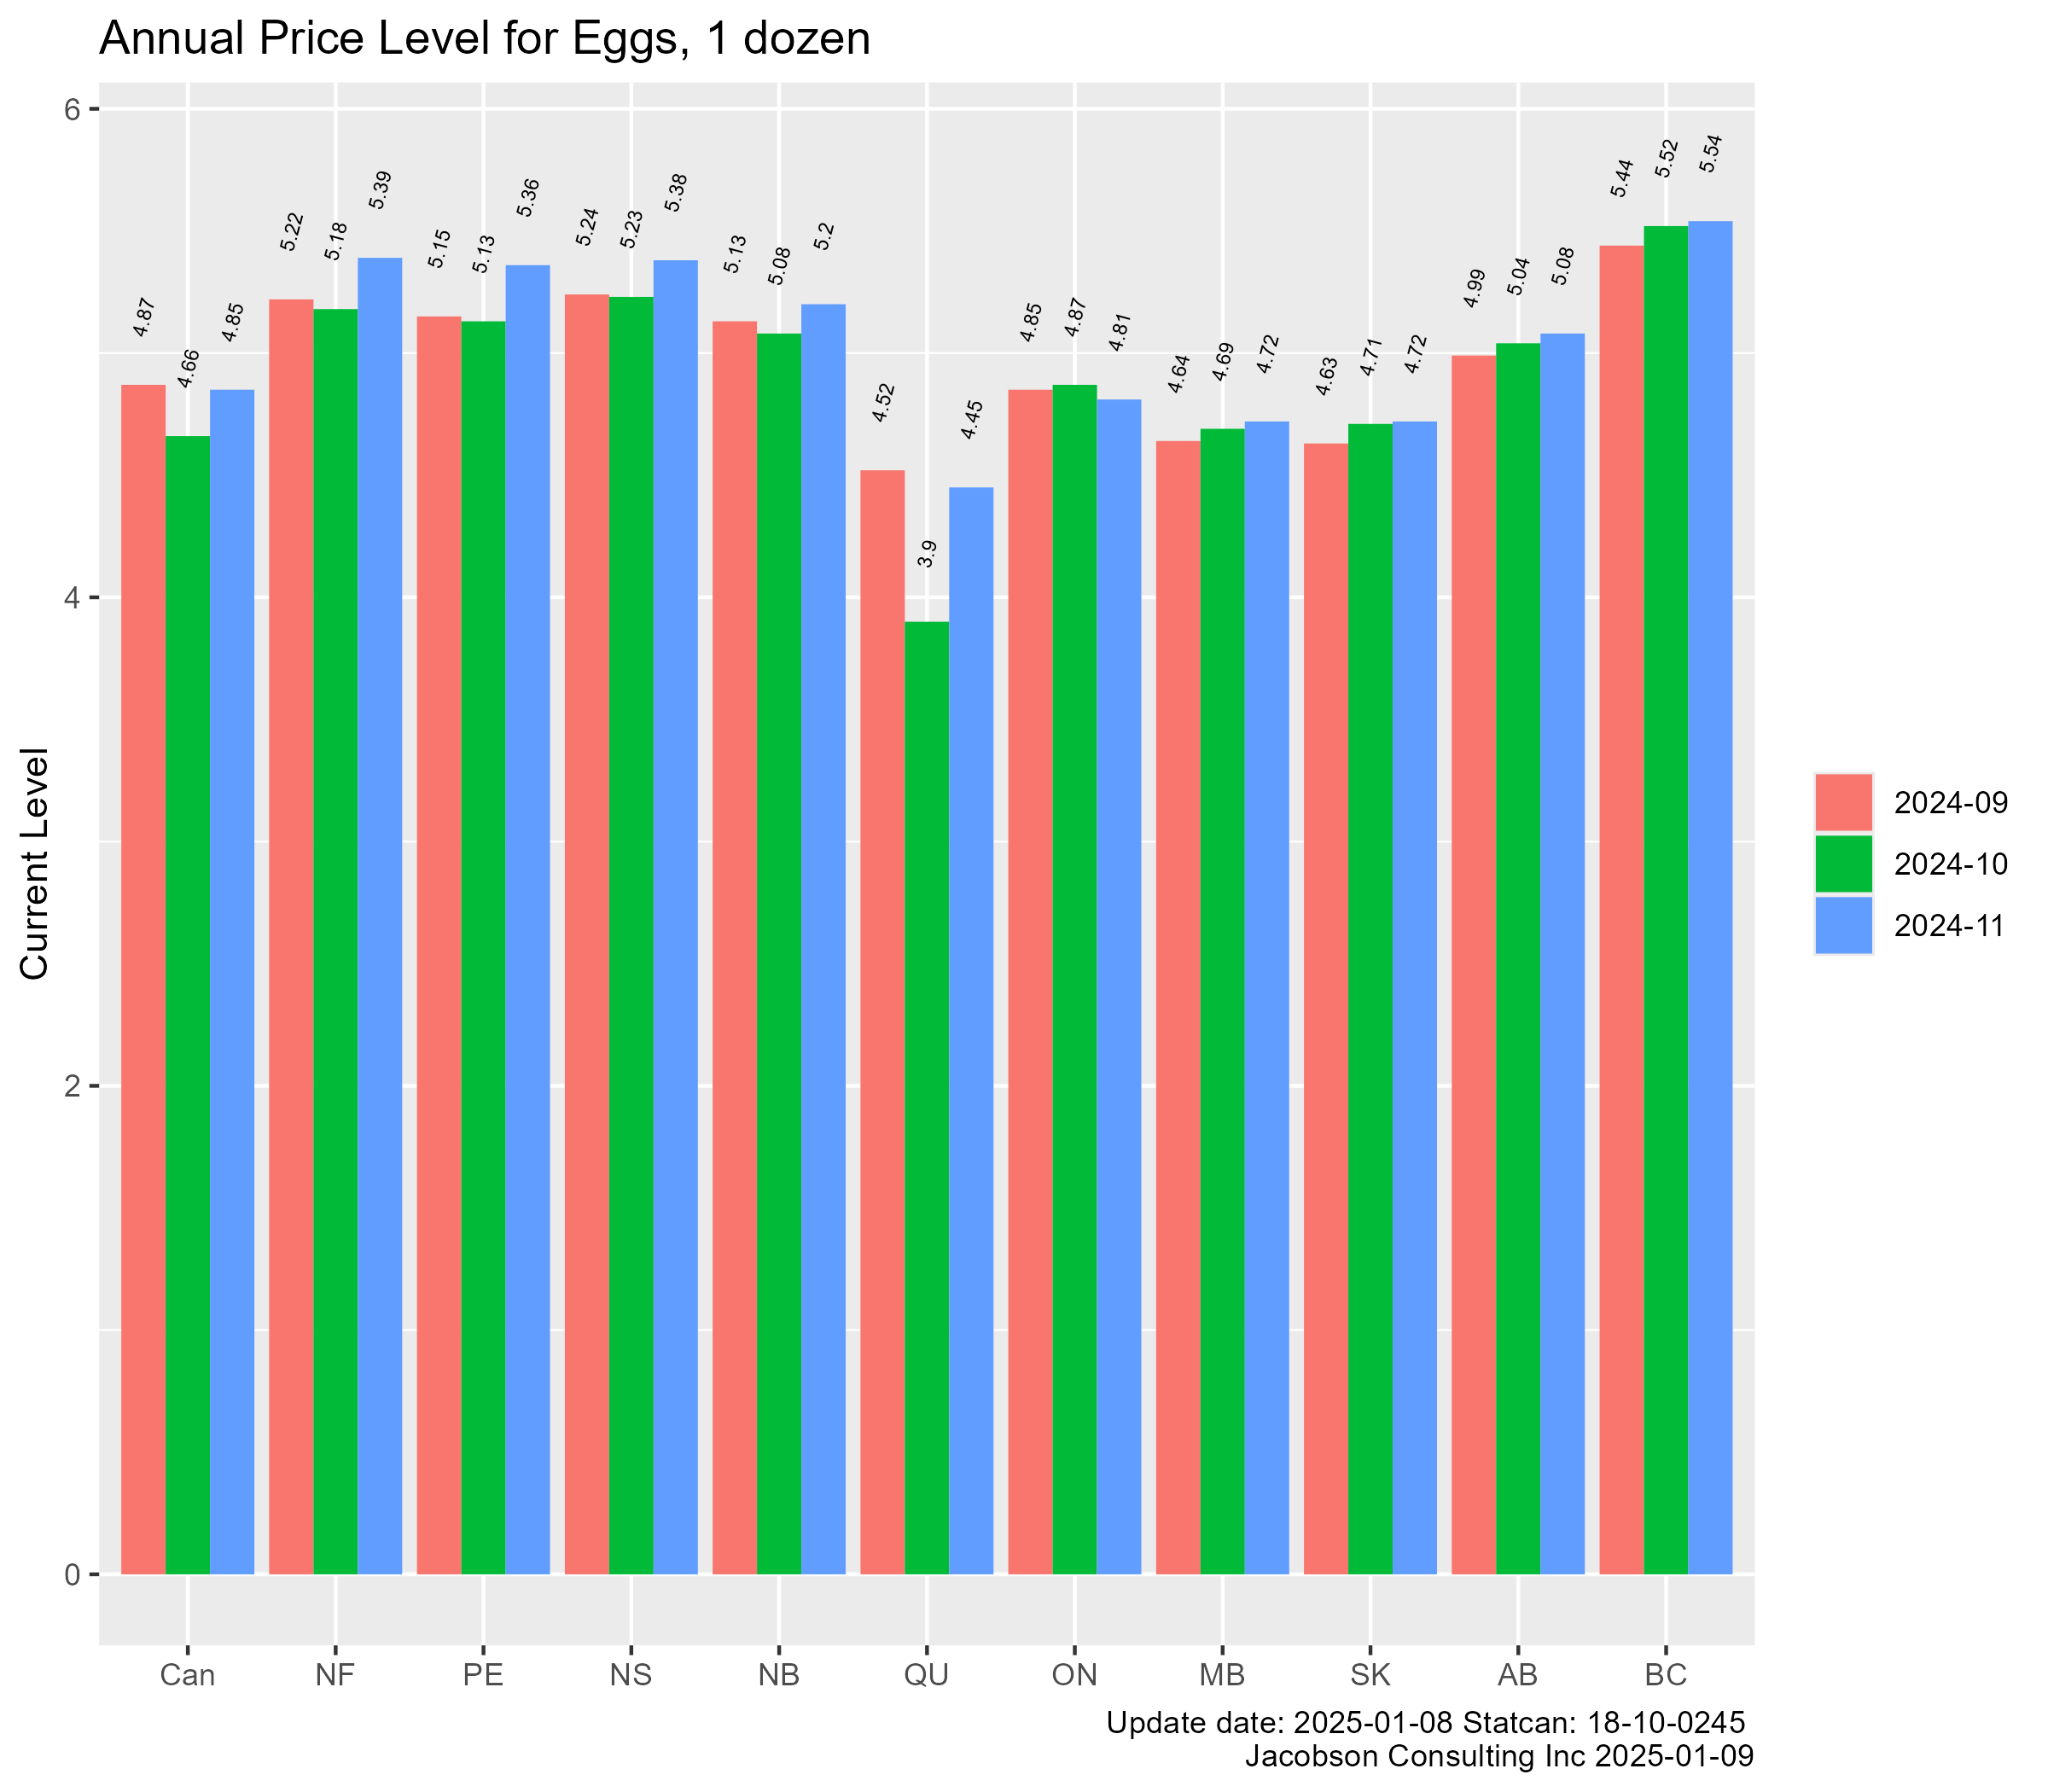
The price in BC is higher but not dramatically so.
US Experience
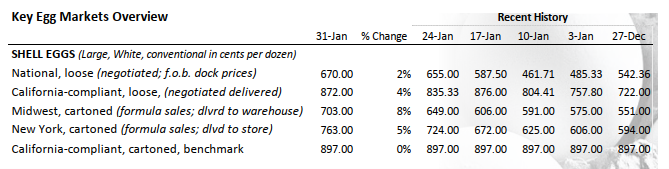
The weekly egg marketing overview from the US Department of Agriculture from the end of January showed that national prices had risen by 23.6% from $5.42 on Dec 27th to $6.70 by January 31.
Detections of Avian flu in the US are shown at this link.
In the US, there just under 380 million egg-laying birds in the US poultry flock. In November, there were about 37 million layers in Canada (32-10-0121).
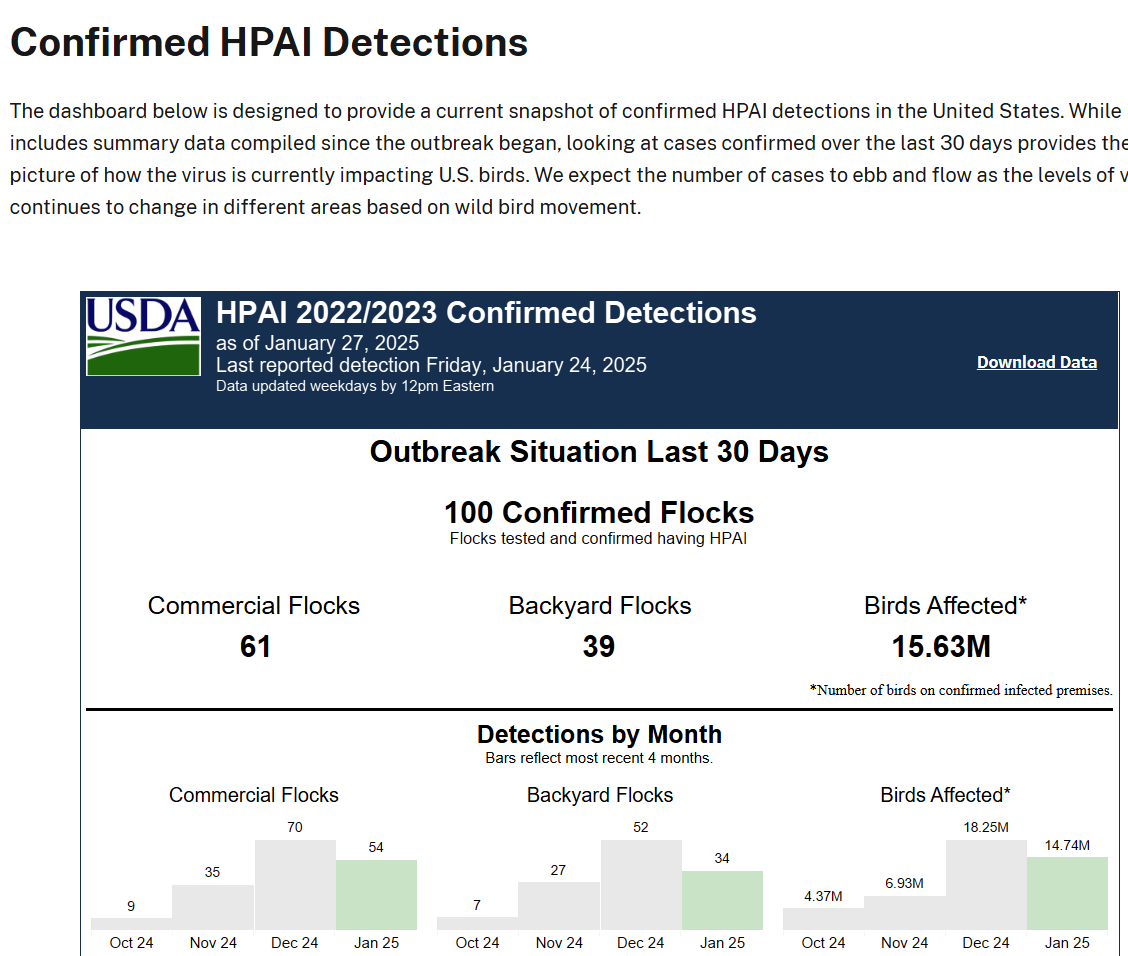
In only the 30 days prior to January 27, 2025, the US total slightly exceeds the Canadian total since the start of the infection issue. In summary the US has a big problem that affects supply and prices and is likely to continue to impact prices for some time.
Summary
Supply is the main issue in agricultural prices for domestic consumption. Supply management has provided stable prices in Canada. Biosecurity issues may be the main factor in supply instability in the US and Canada and particularly in BC. Supply volatility in the US has driven consumer prices around.
AI is not used. Charts and ideas are the responsibility of Paul Jacobson.